XL Edge Guide · VAR 2 Real Macro Data
Vector autoregression with real data: inflation, unemployment and the Fed's rate
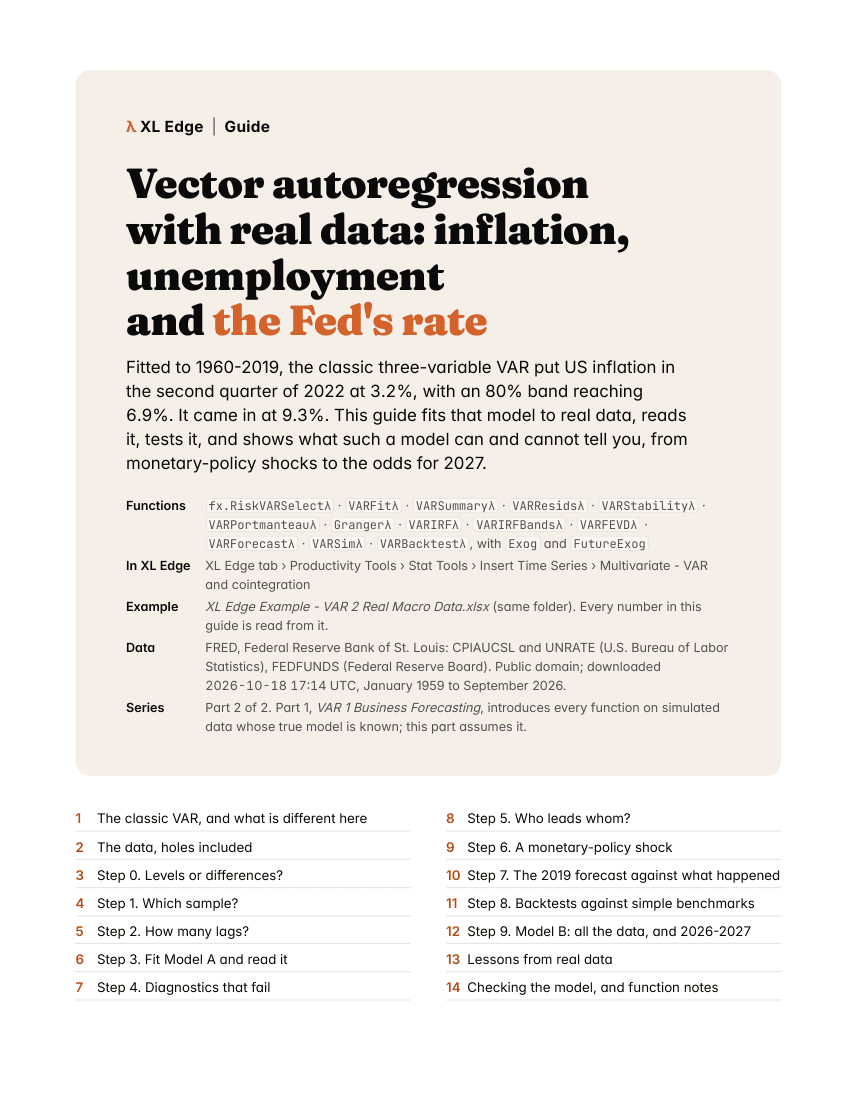
Fitted to 1960–2019, the classic three-variable VAR put US inflation in the second quarter of 2022 at 3.2%, with an 80% band reaching 6.9%. It came in at 9.3%. This guide fits that model to real data, reads it, tests it, and shows what such a model can and cannot tell you, from monetary-policy shocks to the odds for 2027.
What the guide covers
In this guide
- 1The classic VAR, and what is different here
- 2The data, holes included
- 3Step 0. Levels or differences? fx.RiskUnitRootλ
- 4Step 1. Which sample? COVID and exogenous dummies
- 5Step 2. How many lags? fx.RiskVARSelectλ
- 6Step 3. Fit Model A and read it: fx.RiskVARFitλ, fx.RiskVARSummaryλ
- 7Step 4. Diagnostics that fail
- 8Step 5. Who leads whom? fx.RiskGrangerλ
- 9Step 6. A monetary-policy shock: fx.RiskVARIRFλ, fx.RiskVARFEVDλ
- 10Step 7. The 2019 forecast against what happened
- 11Step 8. Backtests against simple benchmarks
- 12Step 9. Model B: all the data, and 2026–2027
- 13Lessons from real data
- 14Checking the model, and function notes
What it uses
- Functions
fx.RiskVARSelectλfx.RiskVARFitλfx.RiskVARSummaryλfx.RiskVARResidsλfx.RiskVARStabilityλfx.RiskVARPortmanteauλfx.RiskGrangerλfx.RiskVARIRFλfx.RiskVARIRFBandsλfx.RiskVARFEVDλfx.RiskVARForecastλfx.RiskVARSimλfx.RiskVARBacktestλ- In the ribbon
- XL Edge tab › Productivity Tools › Stat Tools › Insert Time Series › Multivariate - VAR and cointegration
- Example workbook
- Part 2 of 2; it assumes Part 1. US inflation (CPI), unemployment and the federal funds rate from FRED, January 1959 to September 2026 (public domain), with the October 2025 gap filled visibly. Every number in the guide is read from it.
- Needs
- Excel for Microsoft 365. The workbook carries its own functions in Name Manager, so it calculates with or without XL Edge installed.
Inside
The first four pages
More XL Edge Guides
- BootstrapHow sure are your numbers?
- Confidence EllipseAn interval for two variables at once
- CopulaWhen your inputs move together
- CorrelogramReading a series' memory
- Monte CarloShould we build Plant 2?
- Multivariate Time SeriesSeries that move together: VAR and VECM
- Outliers and LeverageFinding the observations that don't fit
- PortfolioThe efficient frontier in four formulas
- SARIMAForecasting a series with a yearly rhythm
- VAR 1 Business ForecastingForecasting revenue from the orders pipeline