XL Edge Guide · VAR 1 Business Forecasting
Vector autoregression: forecasting revenue from the orders pipeline
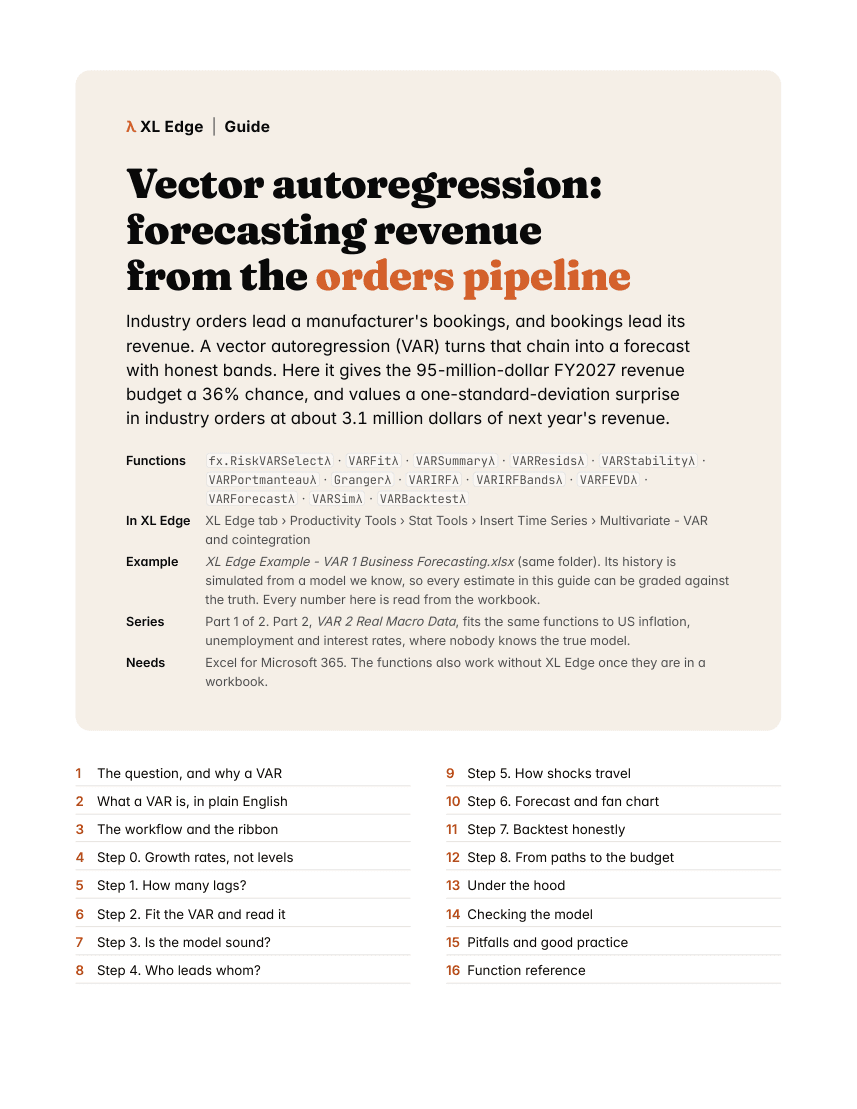
Industry orders lead a manufacturer's bookings, and bookings lead its revenue. A vector autoregression (VAR) turns that chain into a forecast with honest bands. Here it gives the 95-million-dollar FY2027 revenue budget a 36% chance, and values a one-standard-deviation surprise in industry orders at about 3.1 million dollars of next year's revenue.
What the guide covers
In this guide
- 1The question, and why a VAR
- 2What a VAR is, in plain English
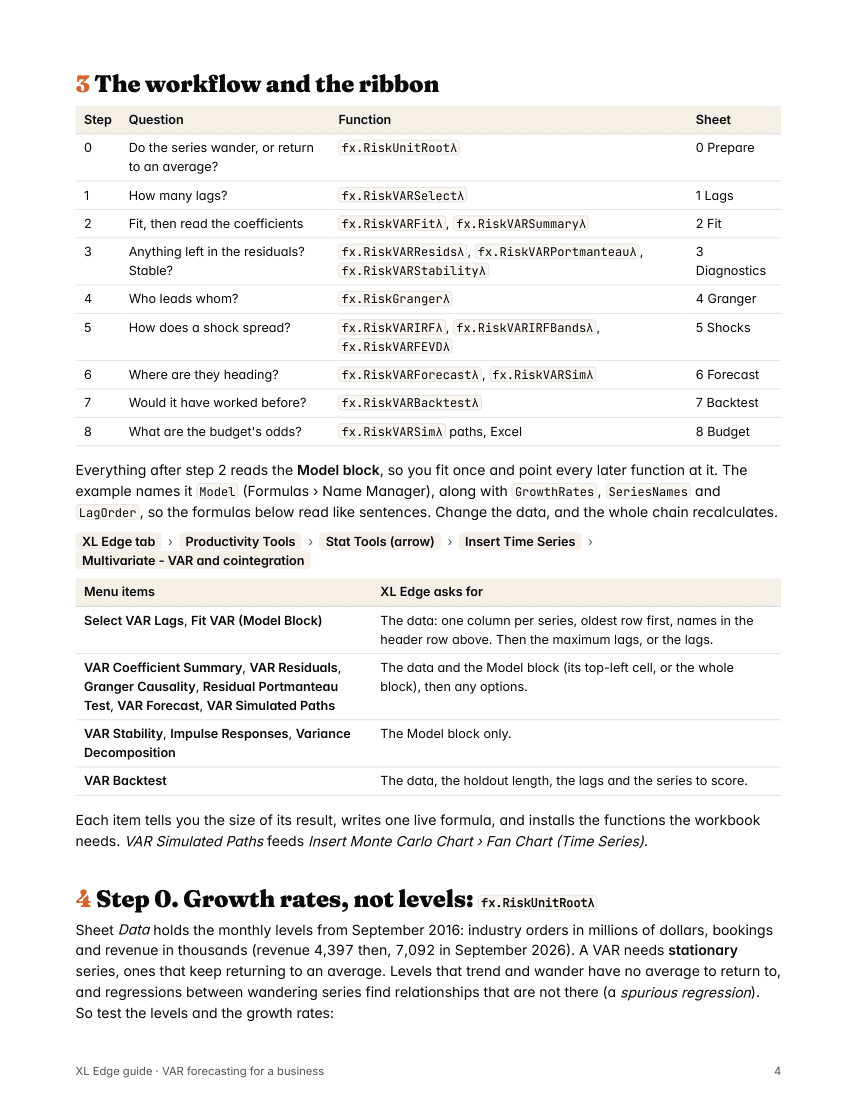
- 3The workflow and the ribbon
- 4Step 0. Growth rates, not levels: fx.RiskUnitRootλ
- 5Step 1. How many lags? fx.RiskVARSelectλ
- 6Step 2. Fit the VAR and read it: fx.RiskVARFitλ, fx.RiskVARSummaryλ
- 7Step 3. Is the model sound?
- 8Step 4. Who leads whom? fx.RiskGrangerλ
- 9Step 5. How shocks travel: fx.RiskVARIRFλ, fx.RiskVARFEVDλ
- 10Step 6. Forecast and fan chart: fx.RiskVARForecastλ, fx.RiskVARSimλ
- 11Step 7. Backtest honestly: fx.RiskVARBacktestλ
- 12Step 8. From paths to the budget
- 13Under the hood
- 14Checking the model
- 15Pitfalls and good practice
What it uses
- Functions
fx.RiskVARSelectλfx.RiskVARFitλfx.RiskVARSummaryλfx.RiskVARResidsλfx.RiskVARStabilityλfx.RiskVARPortmanteauλfx.RiskGrangerλfx.RiskVARIRFλfx.RiskVARIRFBandsλfx.RiskVARFEVDλfx.RiskVARForecastλfx.RiskVARSimλfx.RiskVARBacktestλ- In the ribbon
- XL Edge tab › Productivity Tools › Stat Tools › Insert Time Series › Multivariate - VAR and cointegration
- Example workbook
- Part 1 of 2. The same manufacturer as the Copula and Monte Carlo guides: ten years of monthly industry orders, bookings and revenue, simulated from a known model so every estimate can be graded against the truth. Every number in the guide is read from it.
- Needs
- Excel for Microsoft 365. The workbook carries its own functions in Name Manager, so it calculates with or without XL Edge installed.
Inside
The first four pages
More XL Edge Guides
- BootstrapHow sure are your numbers?
- Confidence EllipseAn interval for two variables at once
- CopulaWhen your inputs move together
- CorrelogramReading a series' memory
- Monte CarloShould we build Plant 2?
- Multivariate Time SeriesSeries that move together: VAR and VECM
- Outliers and LeverageFinding the observations that don't fit
- PortfolioThe efficient frontier in four formulas
- SARIMAForecasting a series with a yearly rhythm
- VAR 2 Real Macro DataInflation, unemployment and the Fed's rate