XL Edge Guide · Portfolio
Portfolio optimization: the efficient frontier in four formulas
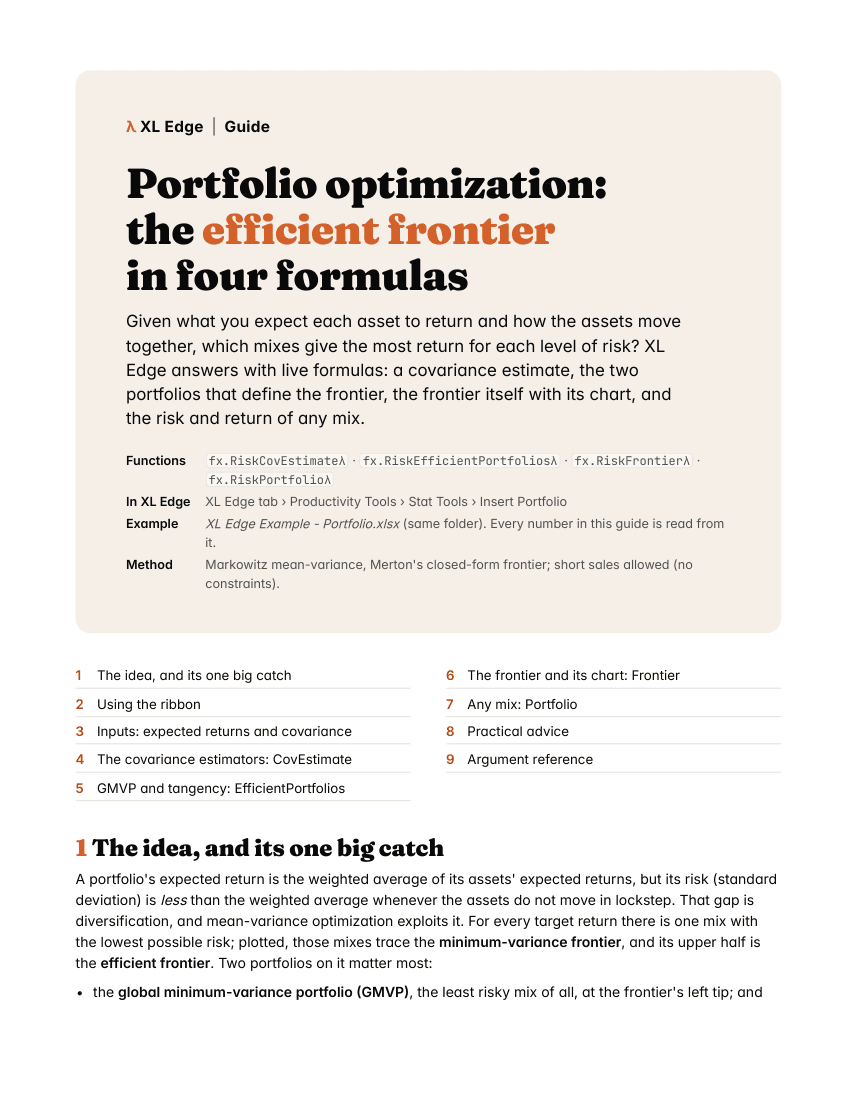
Given what you expect each asset to return and how the assets move together, which mixes give the most return for each level of risk? XL Edge answers with live formulas: a covariance estimate, the two portfolios that define the frontier, the frontier itself with its chart, and the risk and return of any mix.
What the guide covers
In this guide
- 1The idea, and its one big catch
- 2Using the ribbon
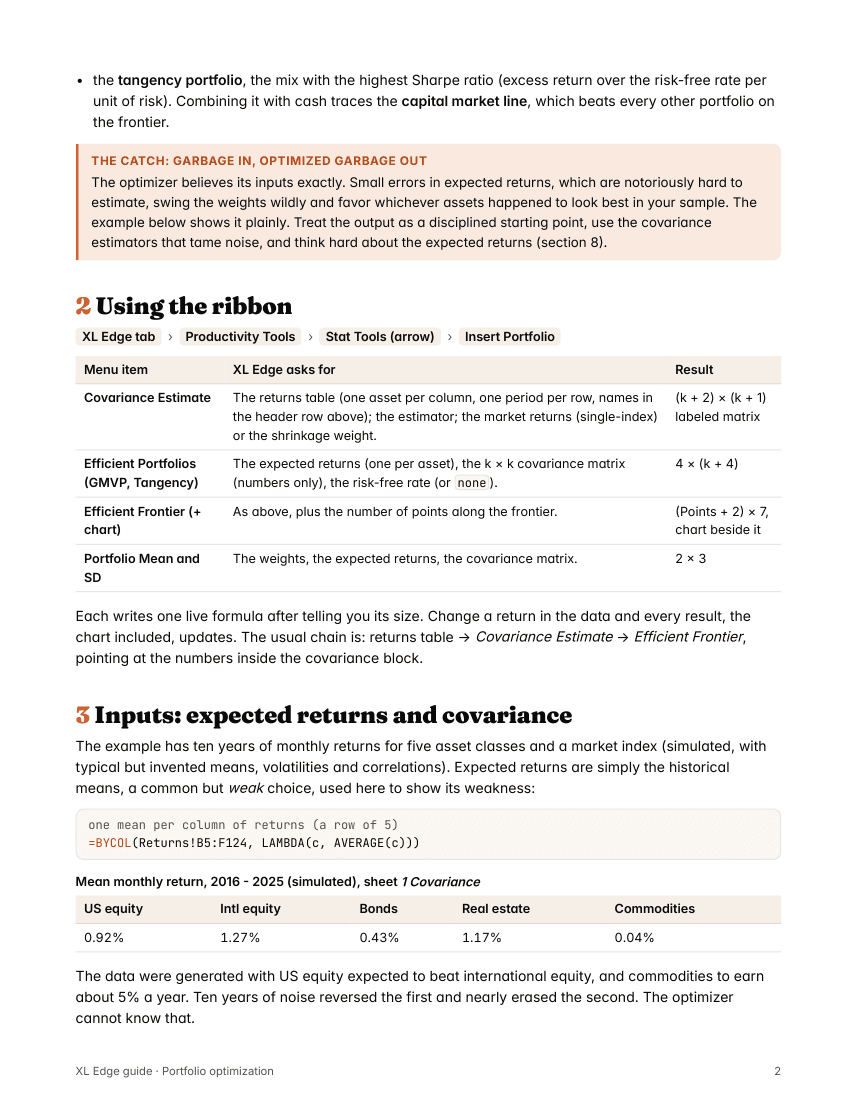
- 3Inputs: expected returns and covariance
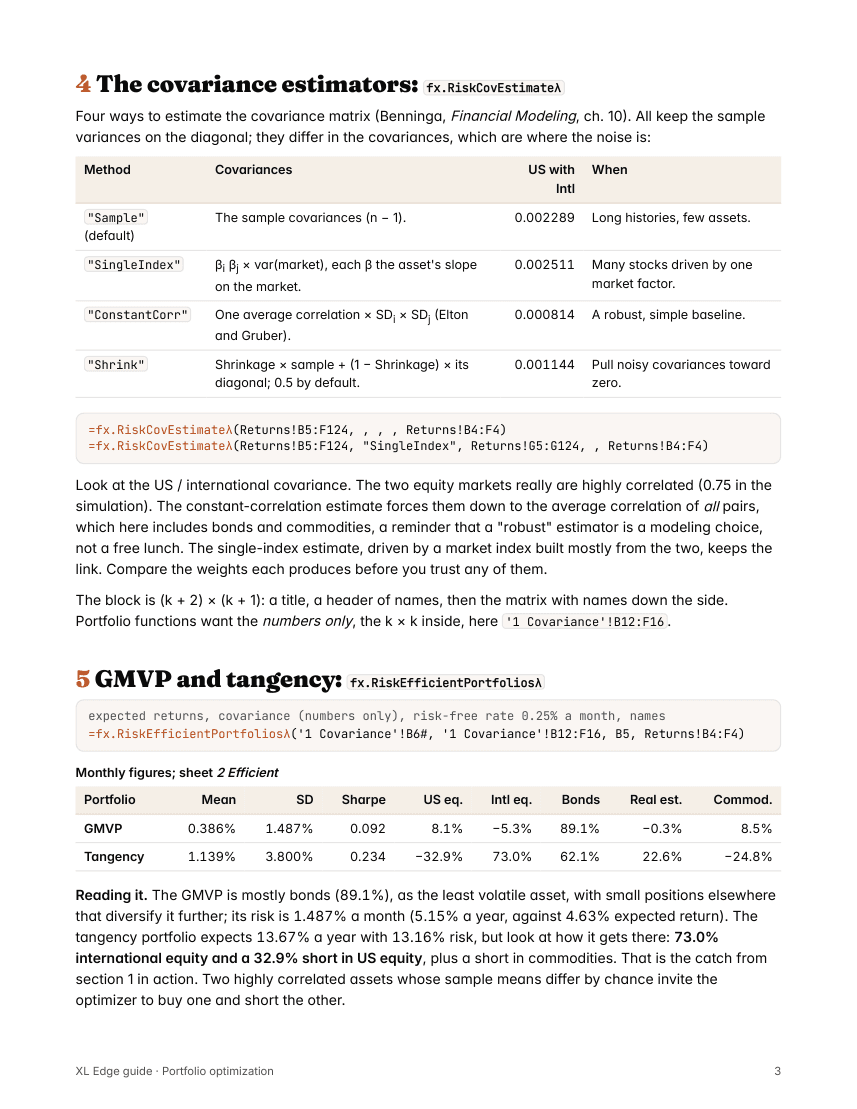
- 4The covariance estimators: fx.RiskCovEstimateλ
- 5GMVP and tangency: fx.RiskEfficientPortfoliosλ
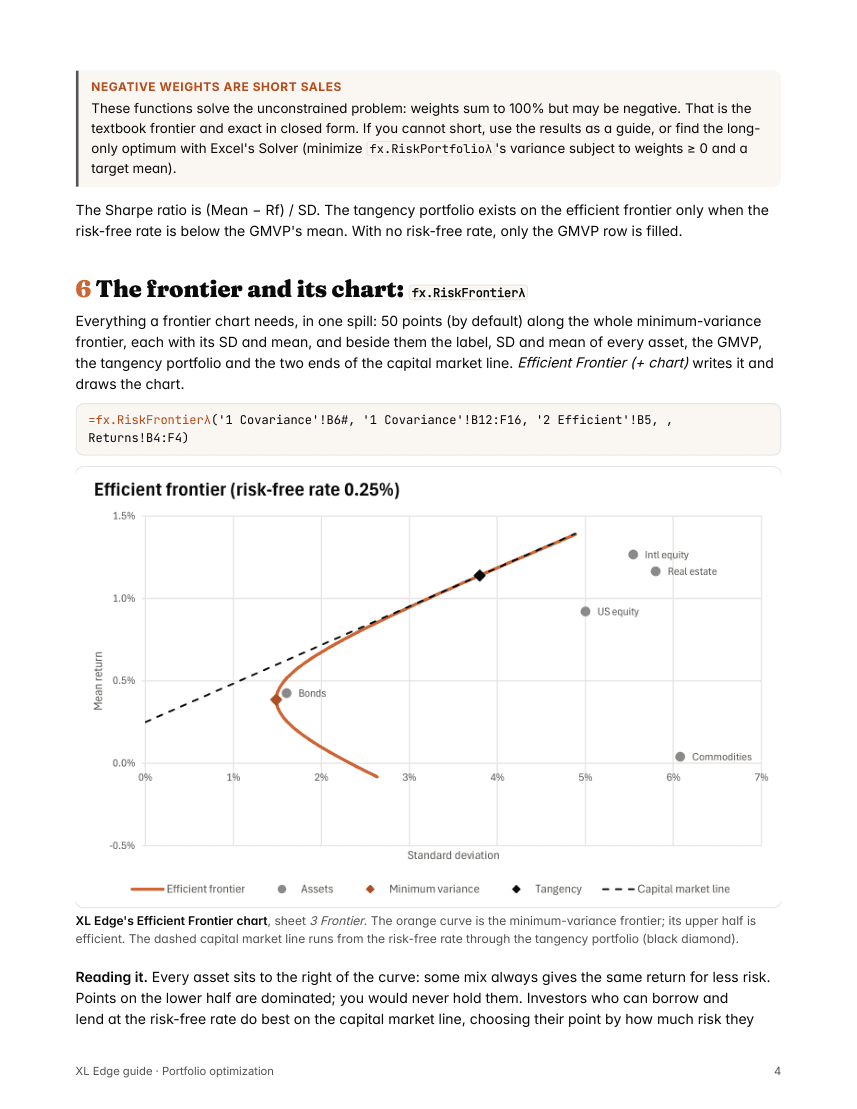
- 6The frontier and its chart: fx.RiskFrontierλ
- 7Any mix: fx.RiskPortfolioλ
- 8Practical advice
- 9Argument reference
What it uses
- Functions
fx.RiskCovEstimateλfx.RiskEfficientPortfoliosλfx.RiskFrontierλfx.RiskPortfolioλ- In the ribbon
- XL Edge tab › Productivity Tools › Stat Tools › Insert Portfolio
- Example workbook
- Simulated returns with a fixed seed. Every number in the guide is read from it.
- Needs
- Excel for Microsoft 365. The workbook carries its own functions in Name Manager, so it calculates with or without XL Edge installed.
Inside
The first four pages
More XL Edge Guides
- BootstrapHow sure are your numbers?
- Confidence EllipseAn interval for two variables at once
- CopulaWhen your inputs move together
- CorrelogramReading a series' memory
- Monte CarloShould we build Plant 2?
- Multivariate Time SeriesSeries that move together: VAR and VECM
- Outliers and LeverageFinding the observations that don't fit
- SARIMAForecasting a series with a yearly rhythm