Excel LAMBDA · Free to use, free to modify
Finding the outliers that break a forecast
Five small functions for z-score outlier detection and reading which members a CUBE slicer actually has applied.
- LAMBDA
- Statistics
- CUBE functions
Detail
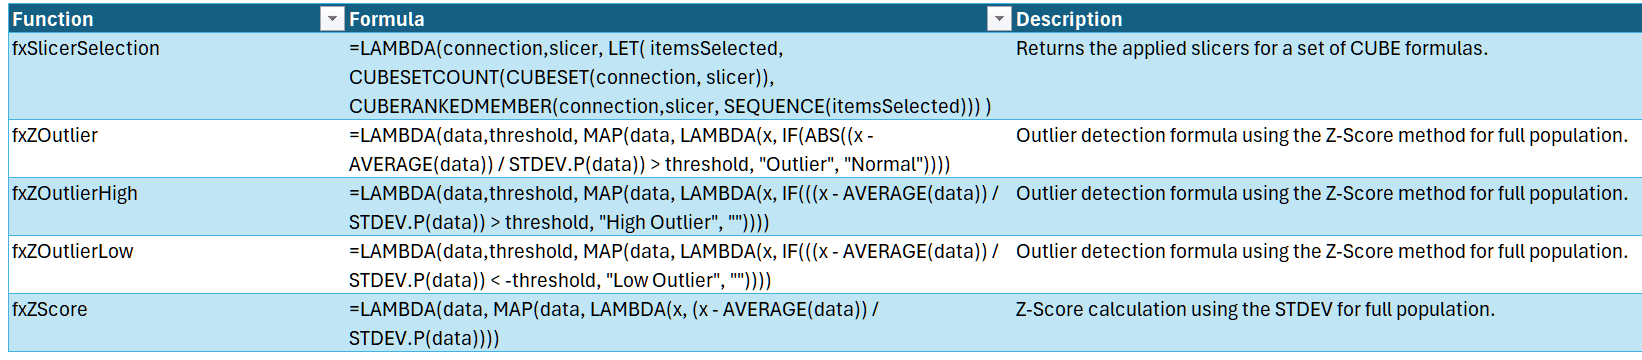
Four of these score a range and label what falls outside a threshold: the raw z-score, a plain outlier flag, and separate high and low variants for when direction matters. All four return an array the same shape as the input, so they spill alongside the data rather than needing a helper column.
They use STDEV.P deliberately. The range you pass is treated as the whole population, not a sample — which is the right choice for a closed period of actuals and the wrong one for inference from a subset. Three standard deviations is the usual threshold.
The fifth is unrelated but lives in the same file: given a connection and a slicer, it returns the members currently applied. Anyone who has tried to caption a CUBE-driven report with what the user actually filtered will know why it exists.
All five are free to use and free to modify — MIT licensed, with no attribution required.