Excel add-in · Free to use, free to modify
XL Edge: a LAMBDA library that lives in the ribbon plus more
Store, search, edit and share custom LAMBDA functions from a ribbon group instead of Name Manager — plus panel charts, Monte Carlo simulation from distributions to finished charts, forecasting from SARIMA to multivariate VAR, regression and statistical diagnostics, bootstrapping, portfolio optimization, and years of productivity macros.
- Excel add-in
- VBA
- LAMBDA
- Charts
- Monte Carlo
- Time series
- Statistics

Detail
Custom LAMBDA functions are powerful and almost impossible to manage. They live in Name Manager, one workbook at a time, with a text box for a formula and nowhere to record what the thing actually does. Moving a function between workbooks means copying strings by hand.
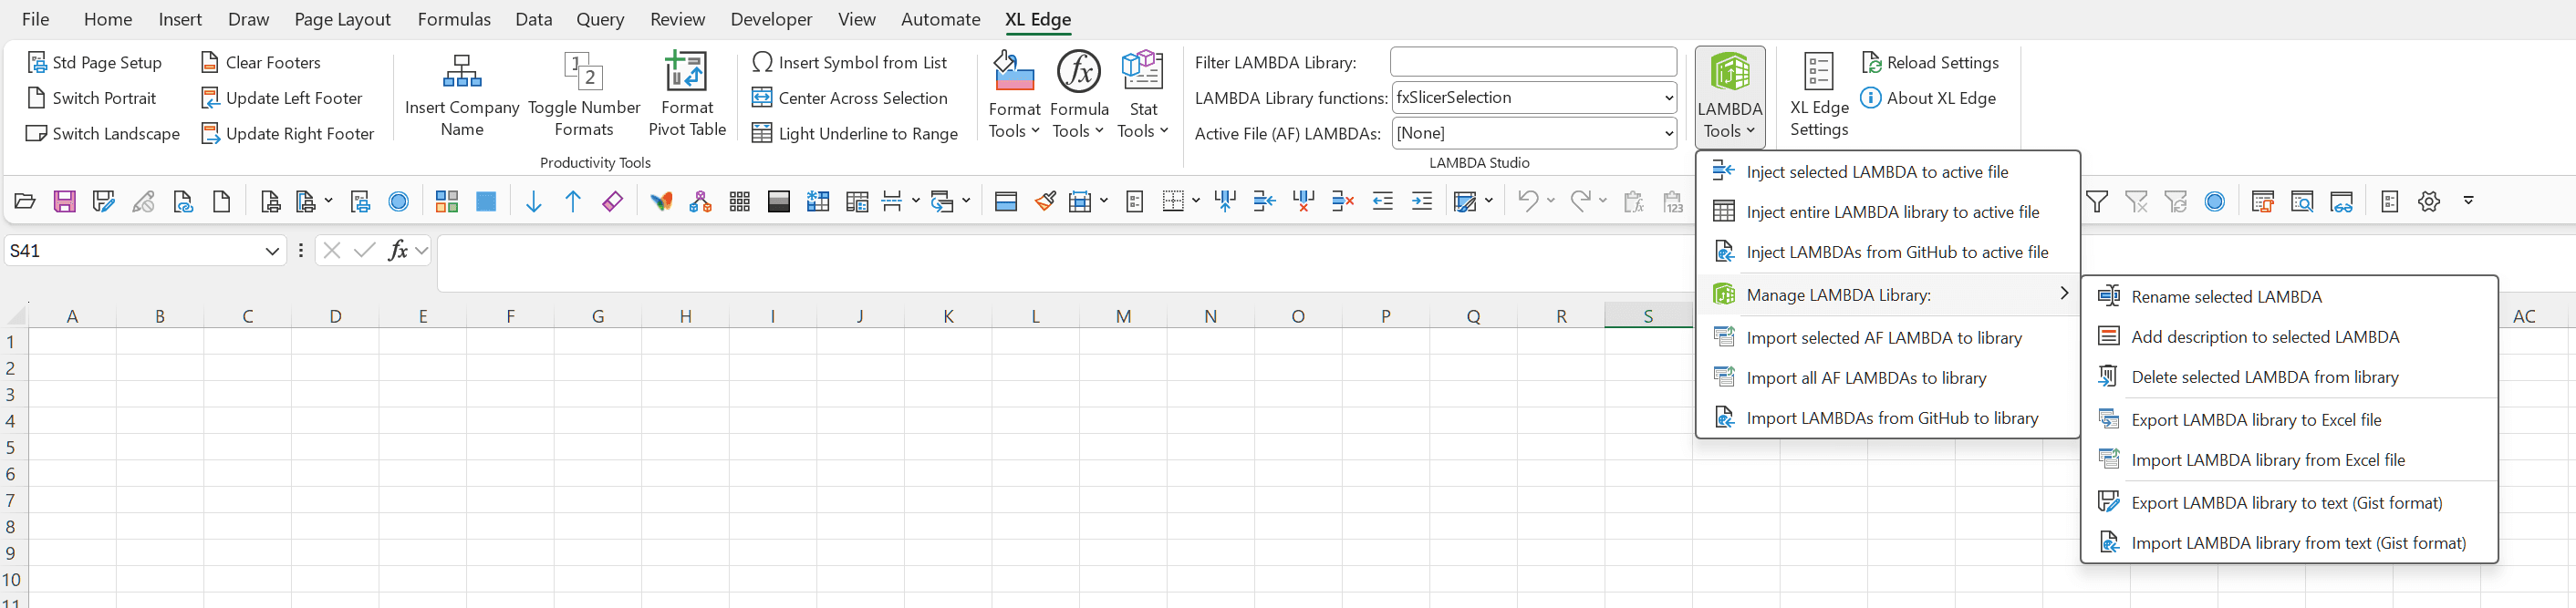
XL Edge adds a LAMBDA Studio group to the Excel ribbon: a stored library of functions with descriptions, a live dropdown, and export or import in two formats — an Excel workbook for colleagues, and the Advanced Formula Environment gist format for anyone publishing to GitHub. The library starts small on purpose, with five functions: the z-score outlier and slicer LAMBDAs from the outlier detection project on this site. The rest of the library is yours to fill.
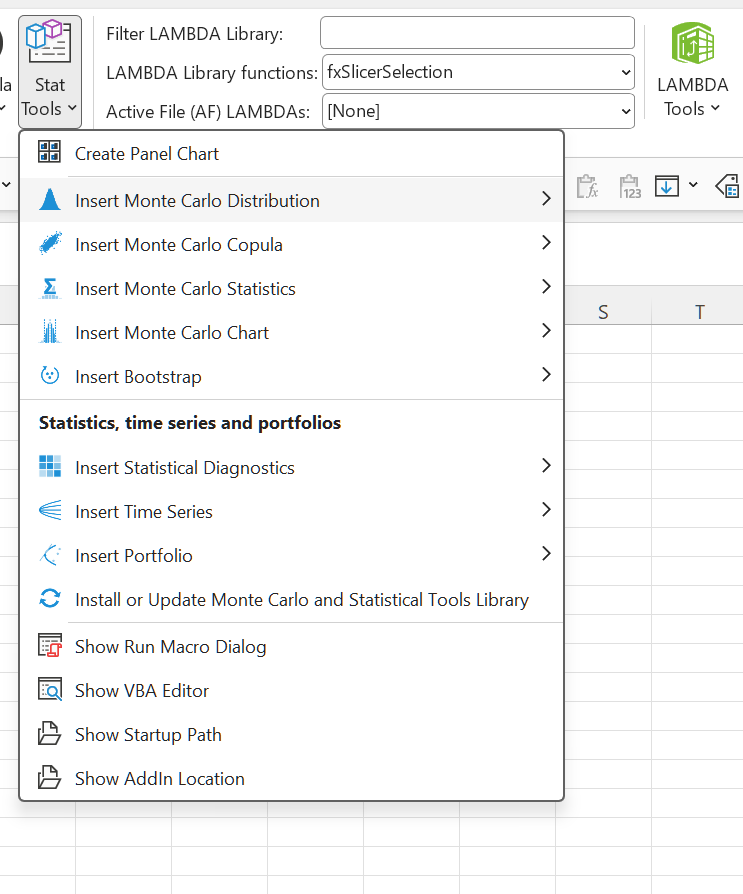
The Stat Tools menu opens with Create Panel Chart: a grid of small charts — one per region, product or partner — sharing a single scale, built as one native chart object rather than a dozen copies whose axes drift apart the moment the data changes. Select a block of data to build from it, or run it with nothing selected to get a placeholder block to paste over.
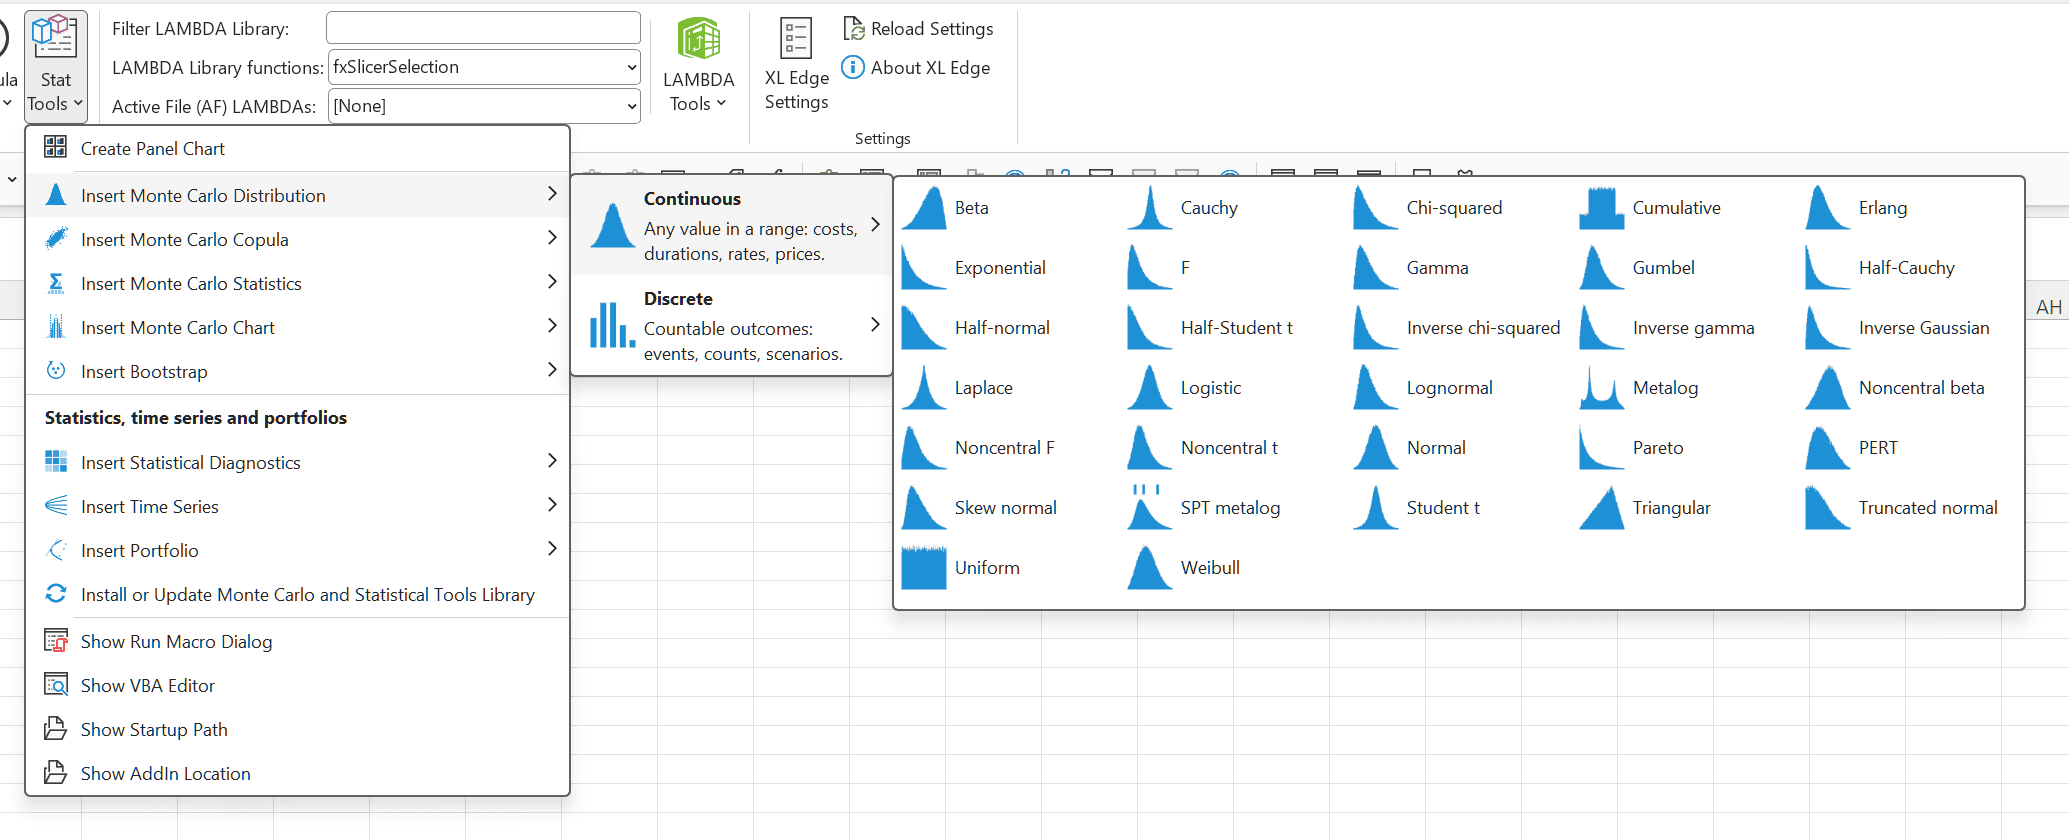
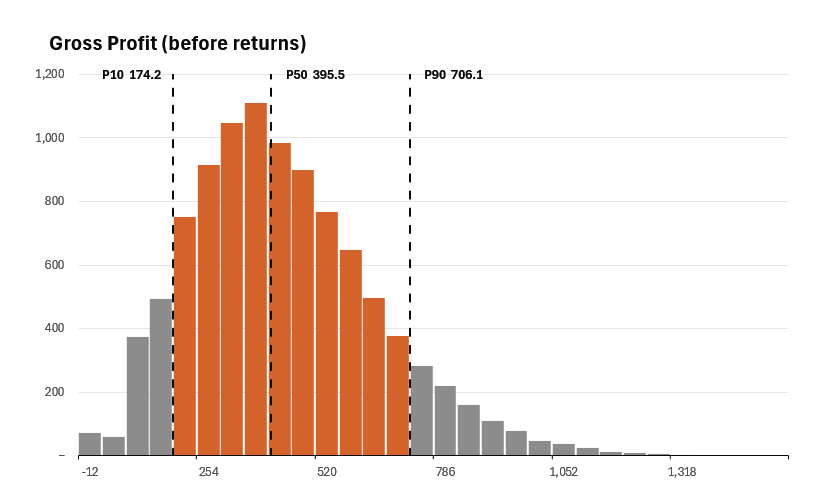
Next on that menu, Monte Carlo simulation. Forty-one distributions — thirty-two continuous, from normal, PERT and triangular to Student t, Pareto, the noncentral family and the metalog, and nine discrete, including Poisson, geometric and Benford's law — go into the workbook as LAMBDA functions, modern versions of the distribution formulas found in tools such as XLRisk and @RISK. Five copulas make inputs move together, so price and volume or frequency and severity are not sampled as if they were unrelated. The Statistics fly-out writes a summary for one result or a table for several, plus the risk measures: Value at Risk, Conditional Value at Risk and Expected Shortfall. The Chart fly-out finishes the job with a native Excel chart — a histogram with its S-curve, an outcome histogram marked at P10, P50 and P90, a tornado ranking the inputs, or a fan chart for a time series. The Bootstrap fly-out resamples your own data instead: how sure is an average, a ratio or a regression slope, with no distribution assumed? Each distribution is a non-volatile dynamic array formula: a single cell spills every trial, and the trials stay put when something unrelated recalculates, because the randomness is keyed to a seed rather than to RAND. The add-in installs only the functions a workbook uses, from its own copy, and only writes formulas, so a finished model keeps working for colleagues who only have the Excel workbook. There is no simulation loop to run — the model is ordinary array arithmetic.
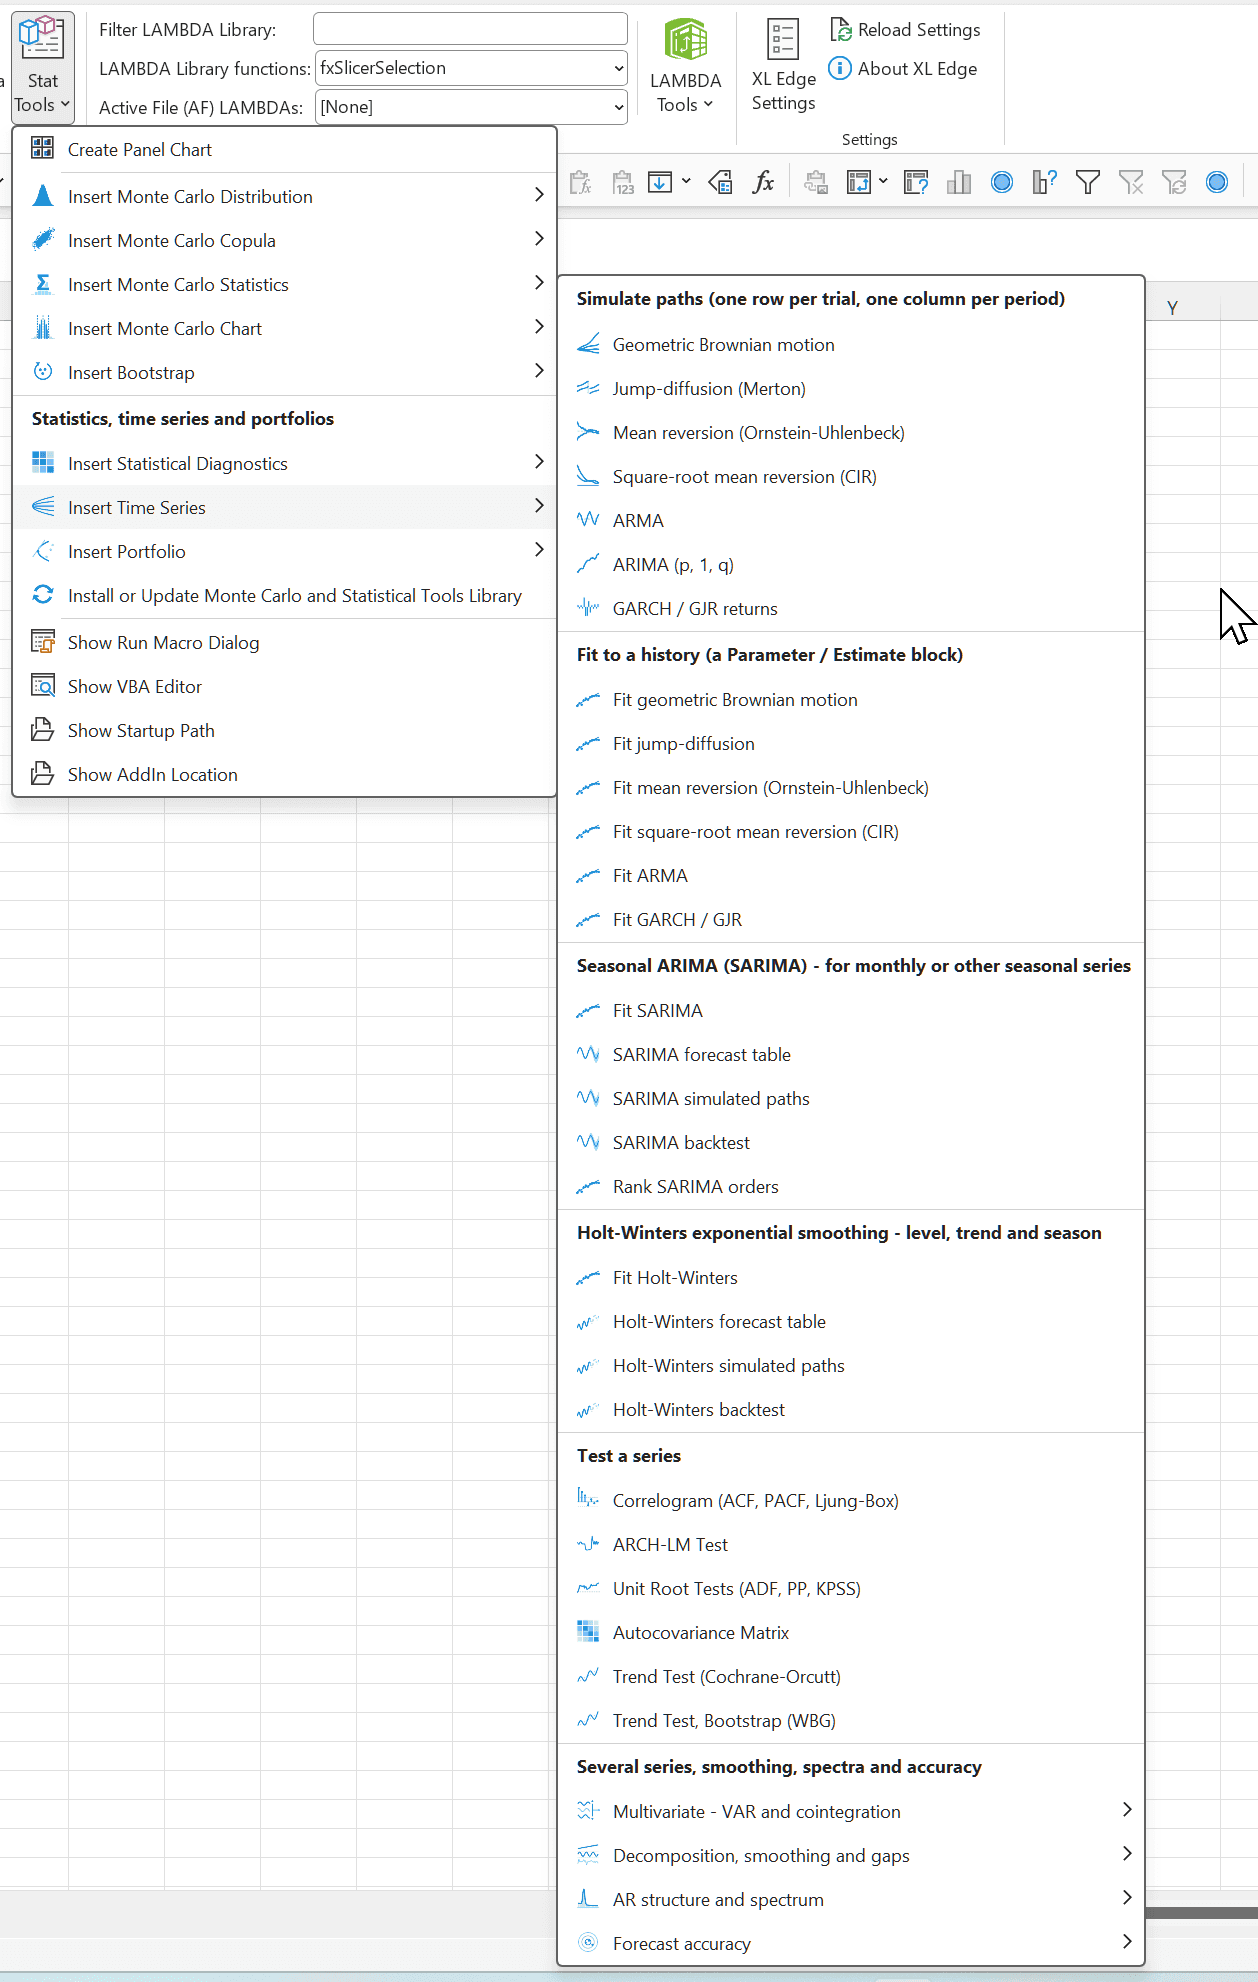
Three more fly-outs carry the same approach to statistics and forecasting. Insert Time Series — 56 commands — simulates paths from seven models and fits each to a history, forecasts a seasonal series with SARIMA or Holt-Winters, tests a series for memory, unit roots and trend, and models several series at once with a VAR or, when their levels are tied, a VECM. Insert Statistical Diagnostics checks the inputs before they are trusted: correlation, normality, multicollinearity and outliers, a full linear regression with its residual tests, Box-Cox, Benford's law and the confidence ellipse. Insert Portfolio builds a mean-variance model down to a chart of the efficient frontier. Every function is documented on the Time Series and Statistical LAMBDAs page, and nine XL Edge Guides walk through the tools on worked examples, each with a workbook to follow along in.
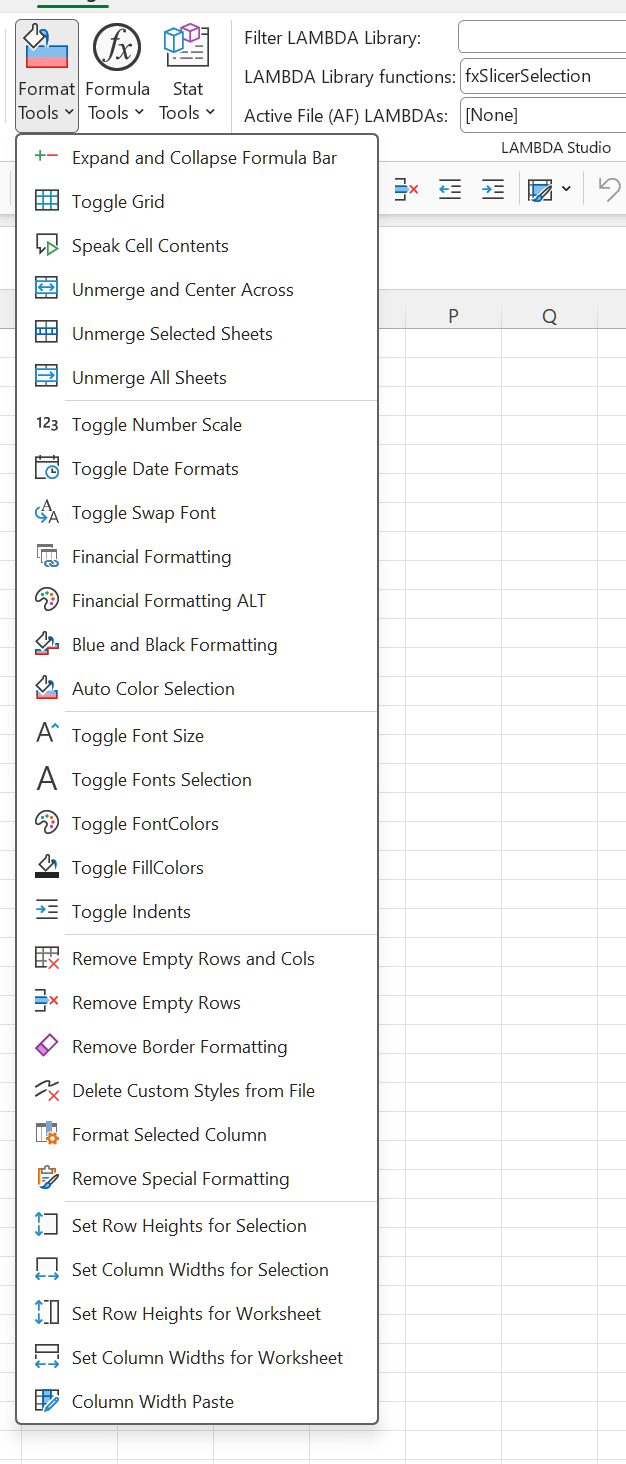
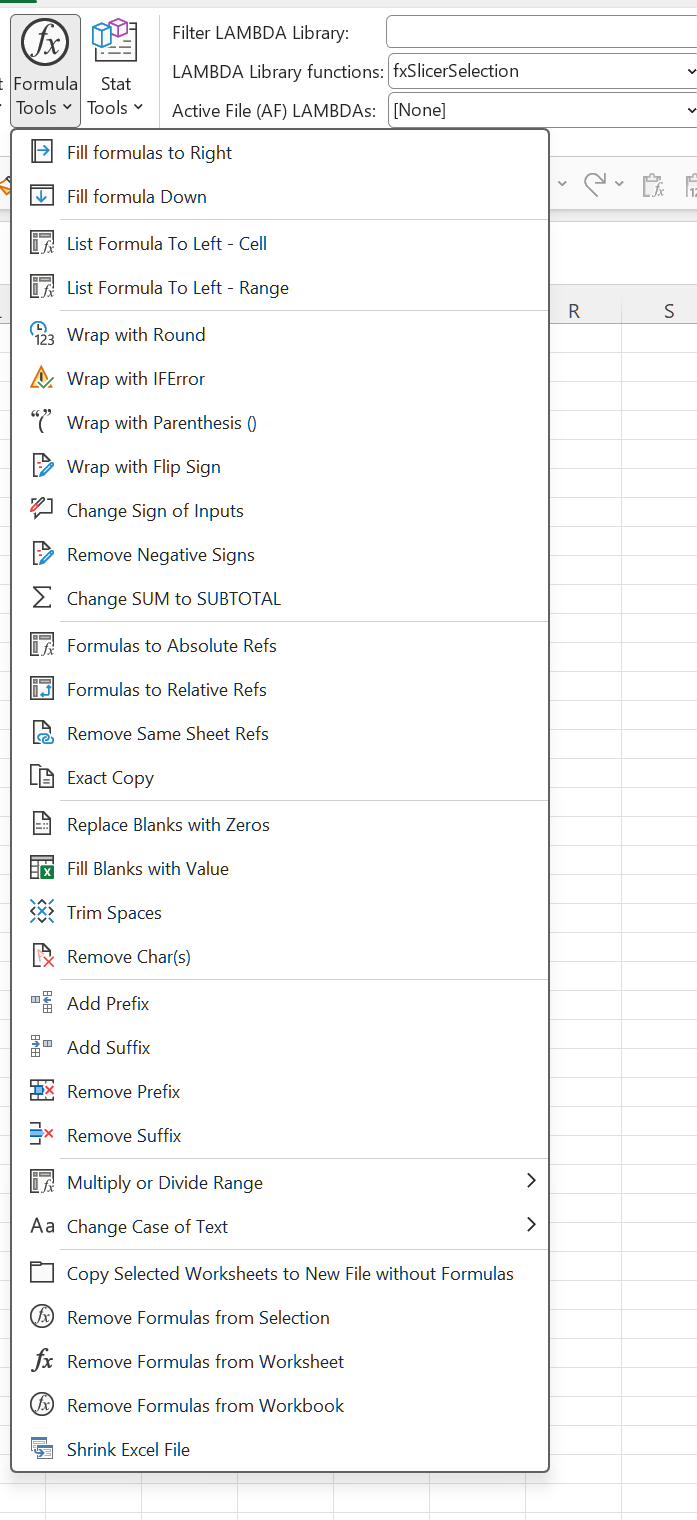
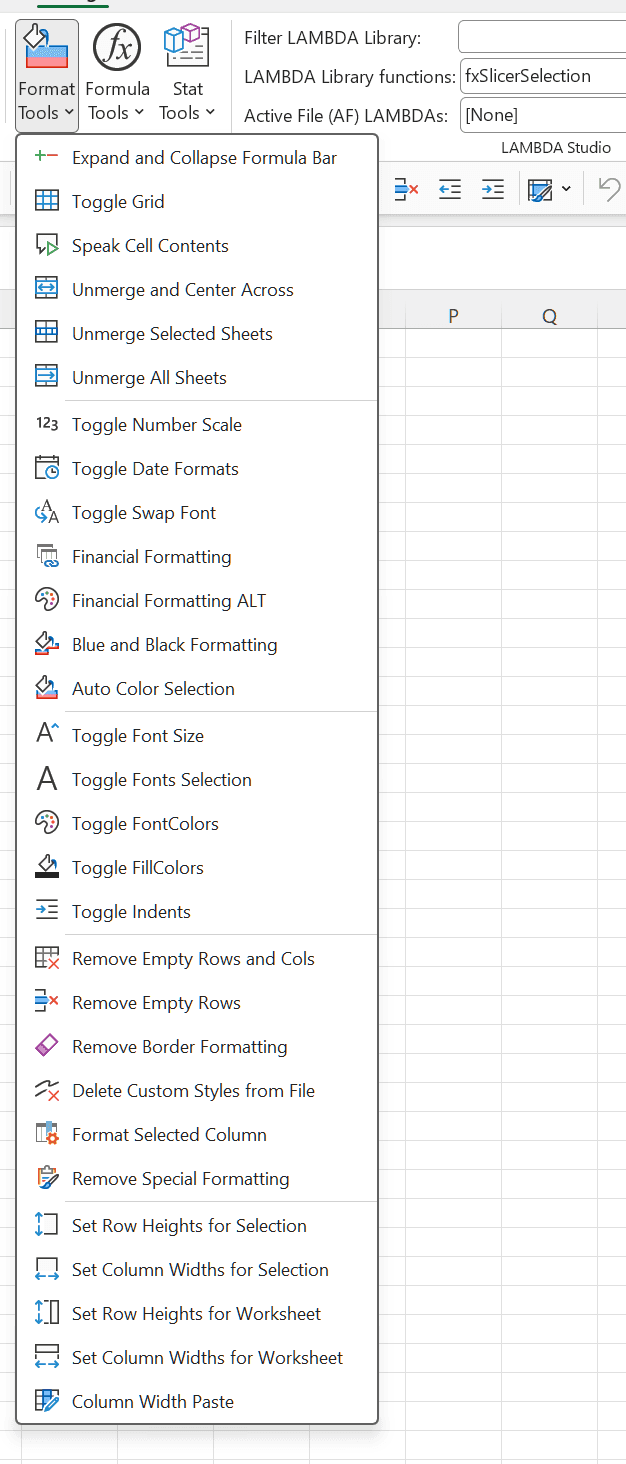
The Format Tools and Formula Tools menus hold the productivity macros developed over years, and nine Ctrl-Shift shortcuts reach the ones used most; a setting hands those keys back to Excel. All were recently refactored by Claude Code using my "excel-macro-optimizer" skill. This ensures modern coding standards are used to assist with speed, reliability, and maintainability.
It is free to use and free to modify — MIT licensed and unrestricted. No sign-up, no trial, no marketing emails.
Reference
What's on each menu
The three menus in the Productivity Tools group. Each one is clipped to fit here — click any of them to open the full-size screenshot and read every item.
 Open the full-size image in a new tab
Format Tools 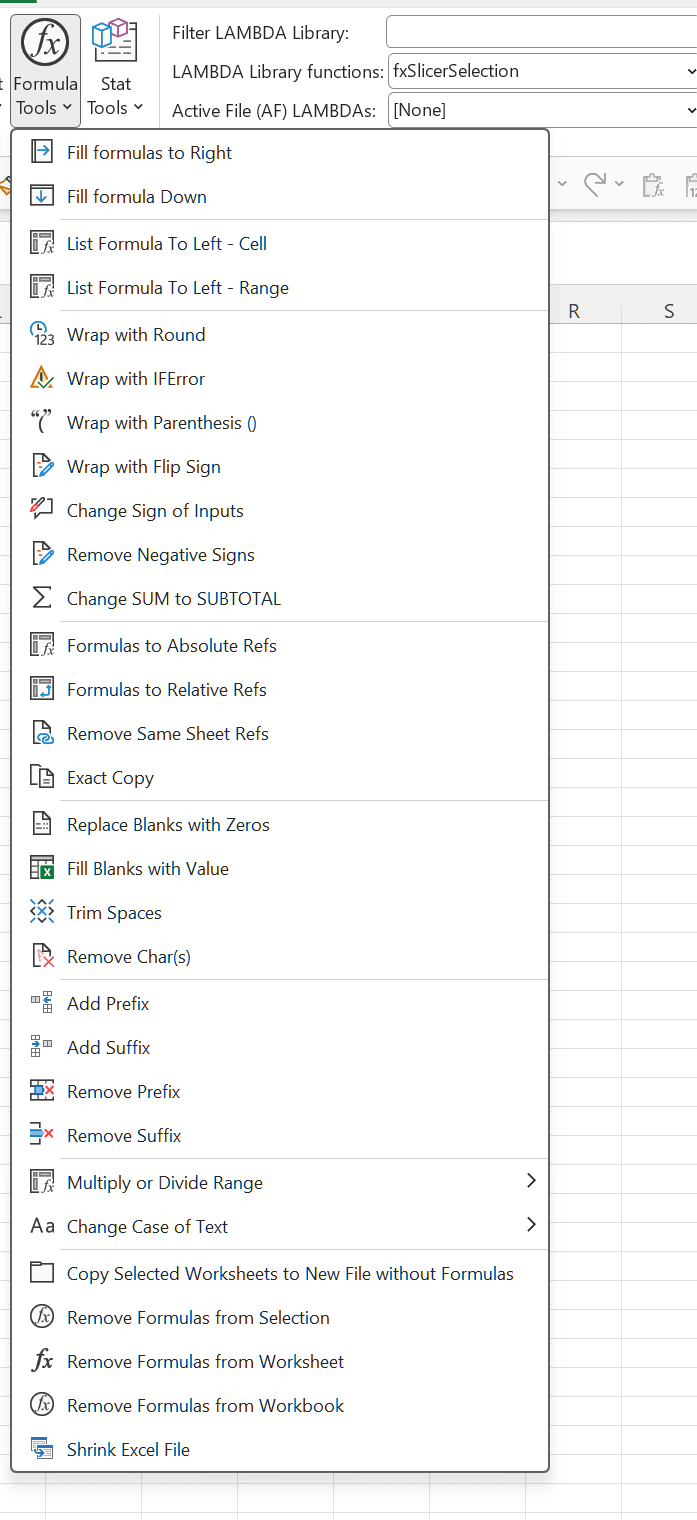 Open the full-size image in a new tab
Formula Tools 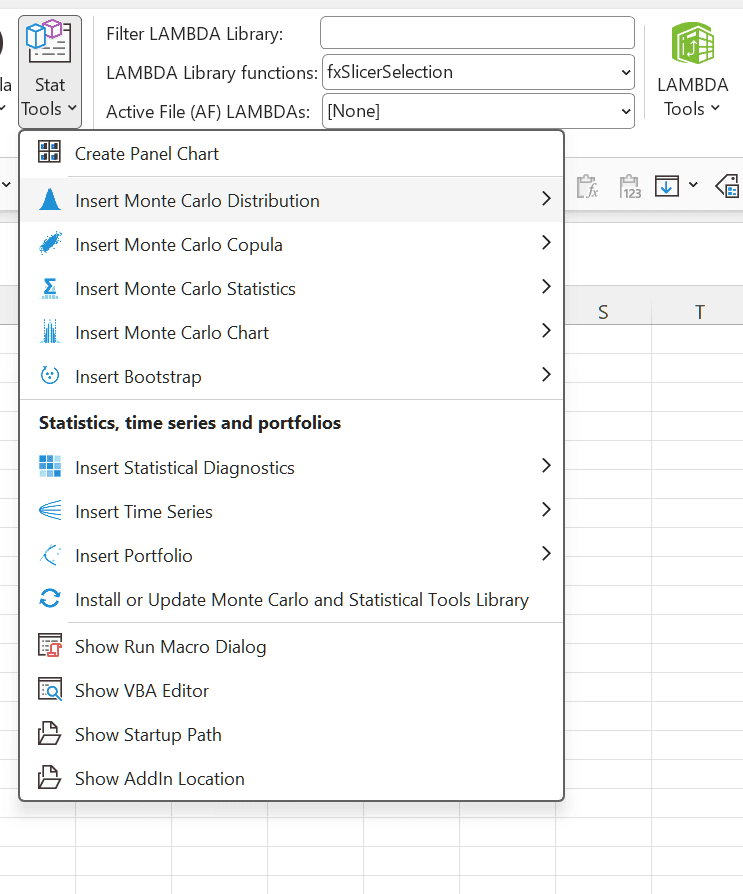 Open the full-size image in a new tab
Stat Tools