XL Edge Guide · Bootstrap
Bootstrapping: how sure are your numbers?
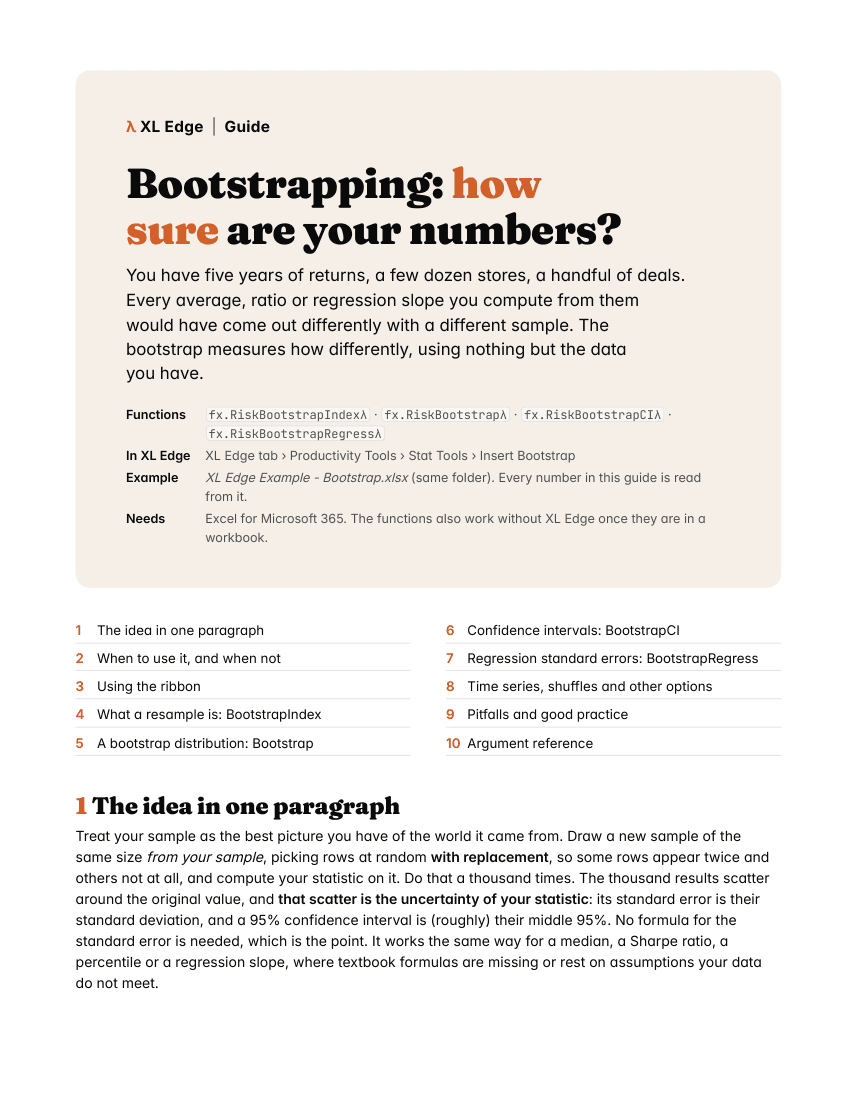
You have five years of returns, a few dozen stores, a handful of deals. Every average, ratio or regression slope you compute from them would have come out differently with a different sample. The bootstrap measures how differently, using nothing but the data you have.
What the guide covers
In this guide
- 1The idea in one paragraph
- 2When to use it, and when not
- 3Using the ribbon
- 4What a resample is: fx.RiskBootstrapIndexλ
- 5A bootstrap distribution: fx.RiskBootstrapλ
- 6Confidence intervals: fx.RiskBootstrapCIλ
- 7Regression standard errors: fx.RiskBootstrapRegressλ
- 8Time series, shuffles and other options
- 9Pitfalls and good practice
- 10Argument reference
What it uses
- Functions
fx.RiskBootstrapIndexλfx.RiskBootstrapλfx.RiskBootstrapCIλfx.RiskBootstrapRegressλ- In the ribbon
- XL Edge tab › Productivity Tools › Stat Tools › Insert Bootstrap
- Example workbook
- Simulated data with a fixed seed. Every number in the guide is read from it.
- Needs
- Excel for Microsoft 365. The workbook carries its own functions in Name Manager, so it calculates with or without XL Edge installed.
Inside
The first four pages
More XL Edge Guides
- Confidence EllipseAn interval for two variables at once
- CopulaWhen your inputs move together
- CorrelogramReading a series' memory
- Monte CarloShould we build Plant 2?
- Multivariate Time SeriesSeries that move together: VAR and VECM
- Outliers and LeverageFinding the observations that don't fit
- PortfolioThe efficient frontier in four formulas
- SARIMAForecasting a series with a yearly rhythm