XL Edge Guide · SARIMA
Seasonal ARIMA: forecasting a series with a yearly rhythm
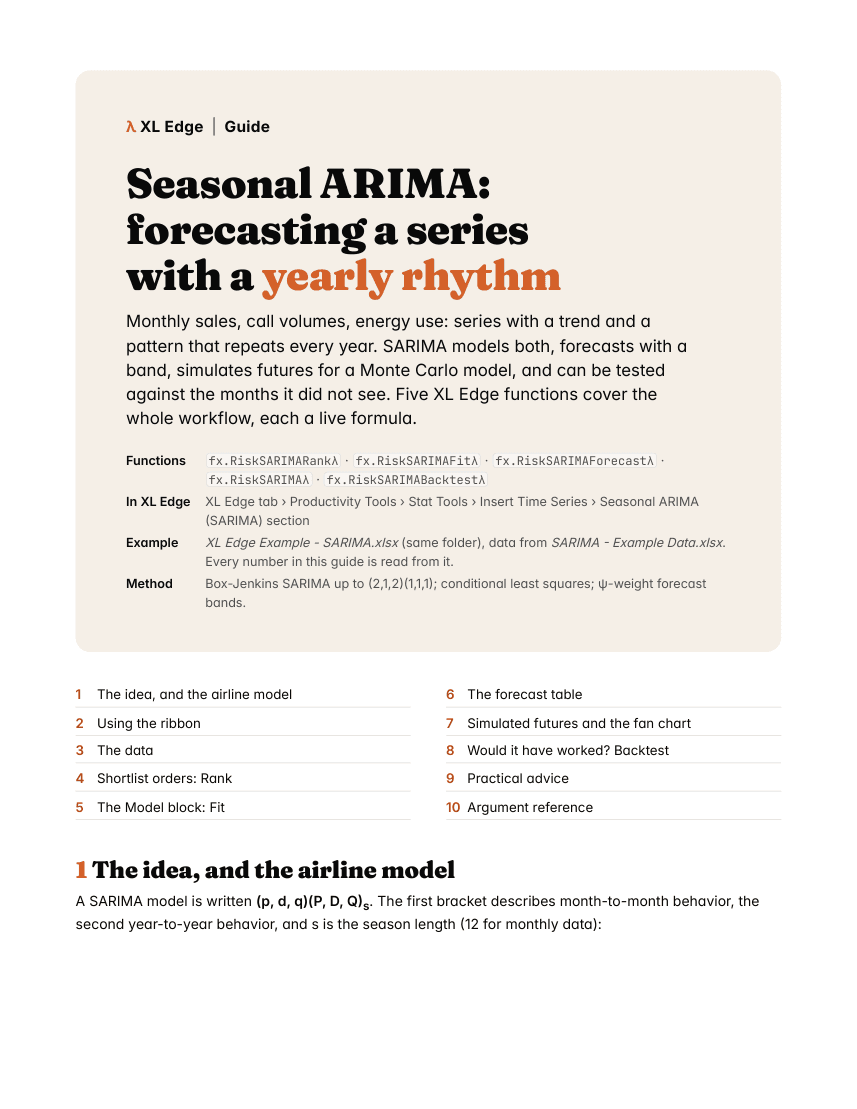
Monthly sales, call volumes, energy use: series with a trend and a pattern that repeats every year. SARIMA models both, forecasts with a band, simulates futures for a Monte Carlo model, and can be tested against the months it did not see. Five XL Edge functions cover the whole workflow, each a live formula.
What the guide covers
In this guide
- 1The idea, and the airline model
- 2Using the ribbon
- 3The data
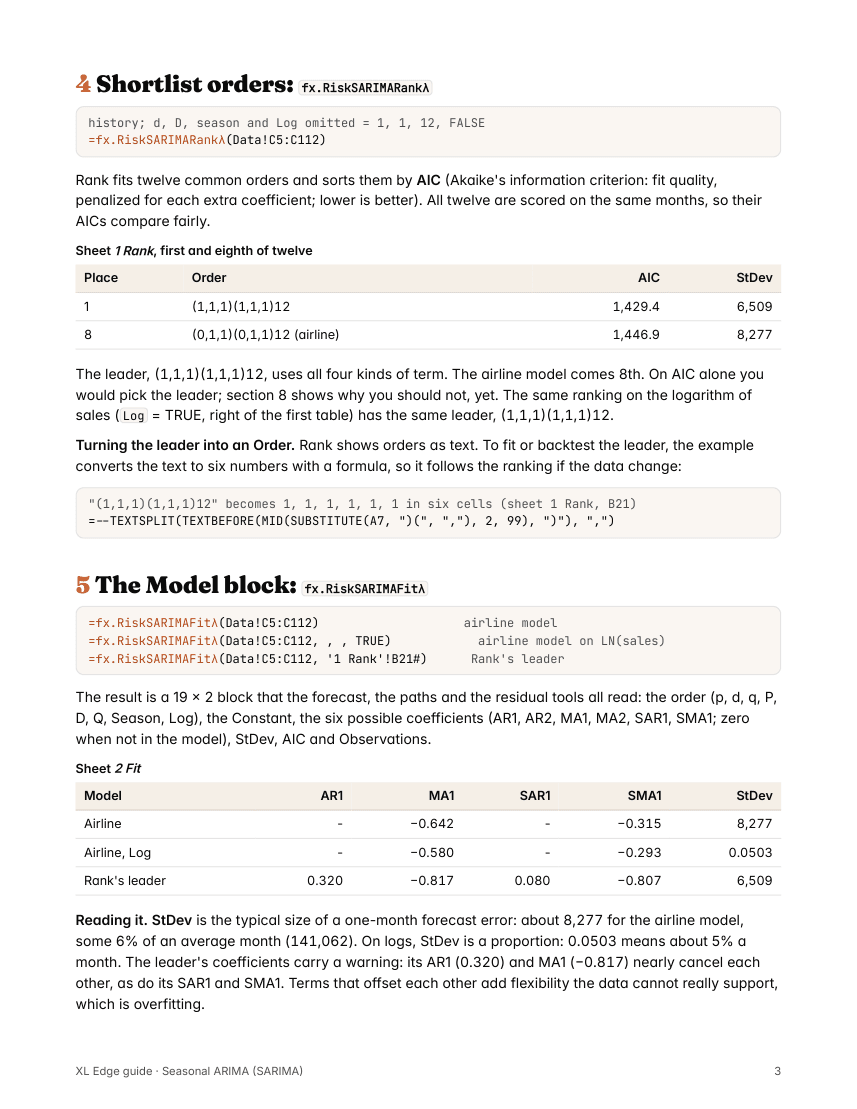
- 4Shortlist orders: fx.RiskSARIMARankλ
- 5The Model block: fx.RiskSARIMAFitλ
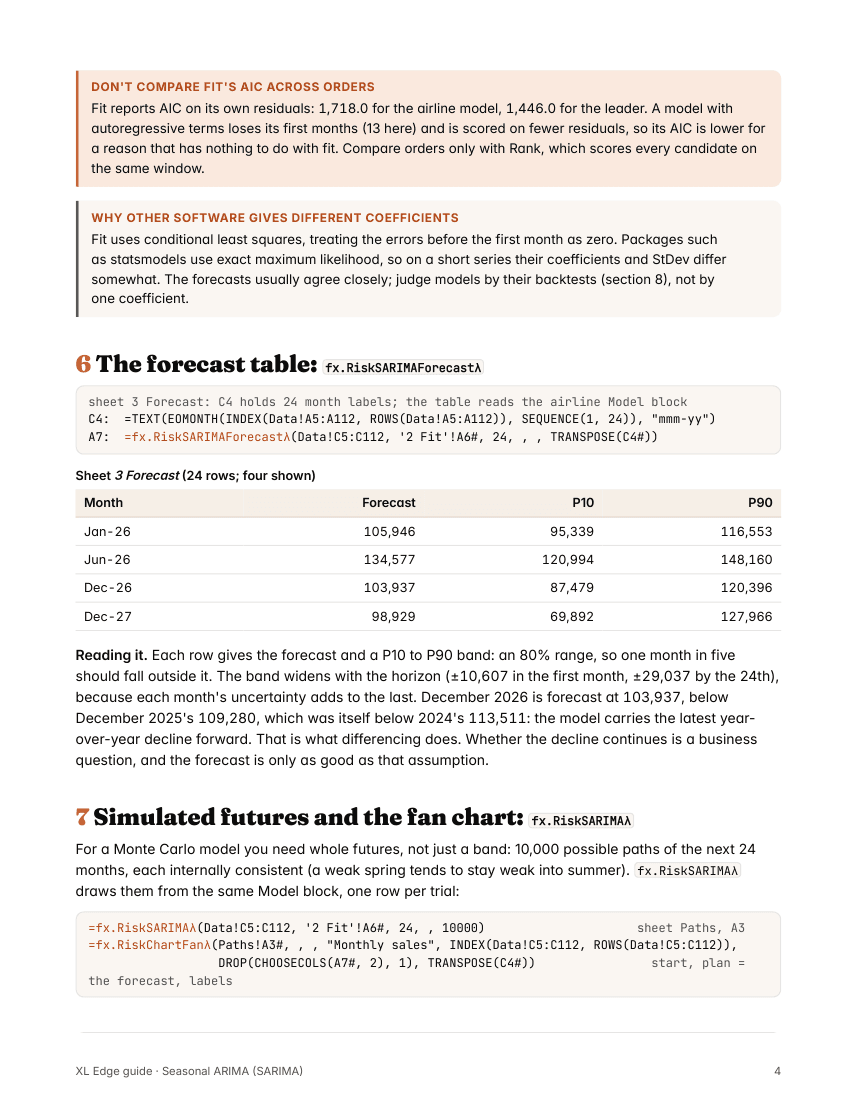
- 6The forecast table: fx.RiskSARIMAForecastλ
- 7Simulated futures and the fan chart: fx.RiskSARIMAλ
- 8Would it have worked? fx.RiskSARIMABacktestλ
- 9Practical advice
- 10Argument reference
What it uses
- Functions
fx.RiskSARIMARankλfx.RiskSARIMAFitλfx.RiskSARIMAForecastλfx.RiskSARIMAλfx.RiskSARIMABacktestλ- In the ribbon
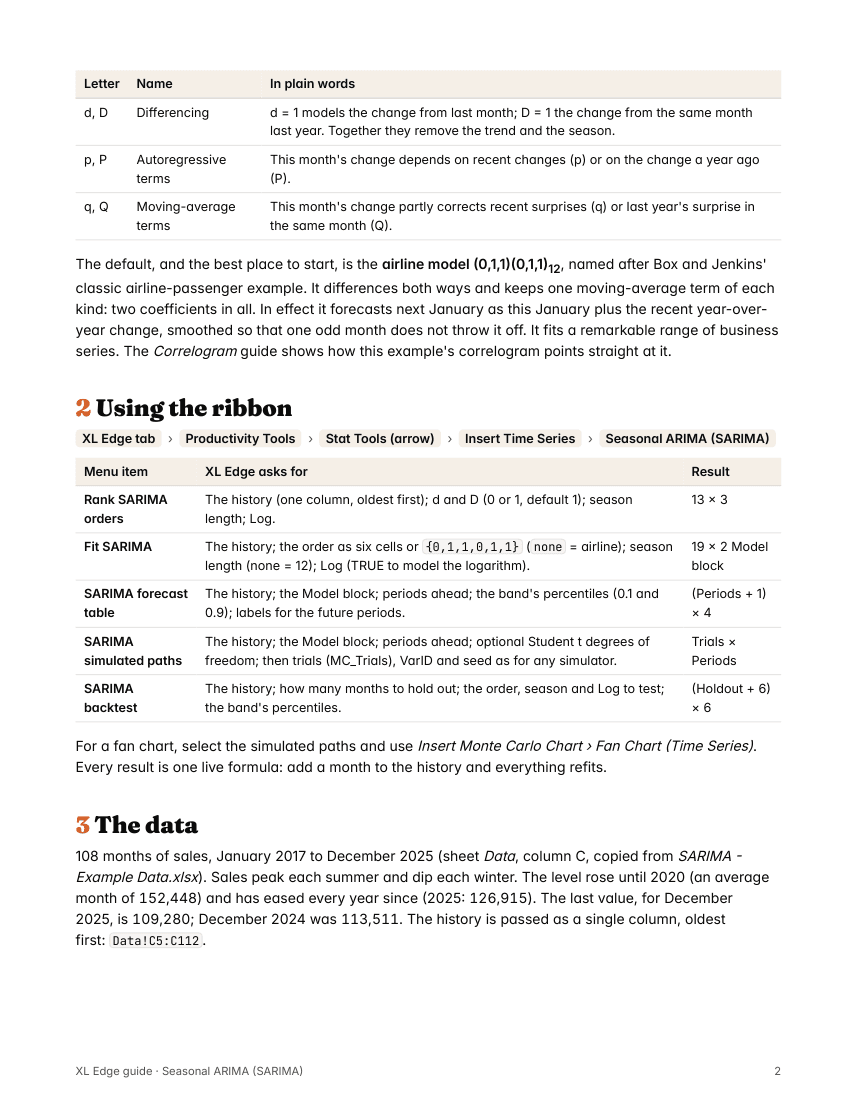
- XL Edge tab › Productivity Tools › Stat Tools › Insert Time Series › Seasonal ARIMA (SARIMA)
- Example workbook
- Monthly sales, the same series as the Correlogram guide. Every number in the guide is read from it.
- Needs
- Excel for Microsoft 365. The workbook carries its own functions in Name Manager, so it calculates with or without XL Edge installed.
Inside
The first four pages
More XL Edge Guides
- BootstrapHow sure are your numbers?
- Confidence EllipseAn interval for two variables at once
- CopulaWhen your inputs move together
- CorrelogramReading a series' memory
- Monte CarloShould we build Plant 2?
- Multivariate Time SeriesSeries that move together: VAR and VECM
- Outliers and LeverageFinding the observations that don't fit
- PortfolioThe efficient frontier in four formulas