Excel + Claude Code skill · Free to use, free to modify
Small multiples in Excel that actually share a scale
A grid of charts built as one native Excel chart object rather than as R × C copies whose axes quietly drift apart.
- Excel
- Claude Code skill
- Small multiples
- Reference workbookExcel · 242 KB · all six chart types, one sheet each
- Manual build stepsMarkdown · 19 KB · building the grid by hand in Excel
- View the project on GitHub (opens in a new tab)The skill itself, the source, and the full history
A panel chart — small multiples, trellis, lattice, call it what you like — plots identical sub charts repeated for every region, product or partner so they can be read against each other. The comparison is the entire point, and the comparison only holds if every panel is on the same scale.
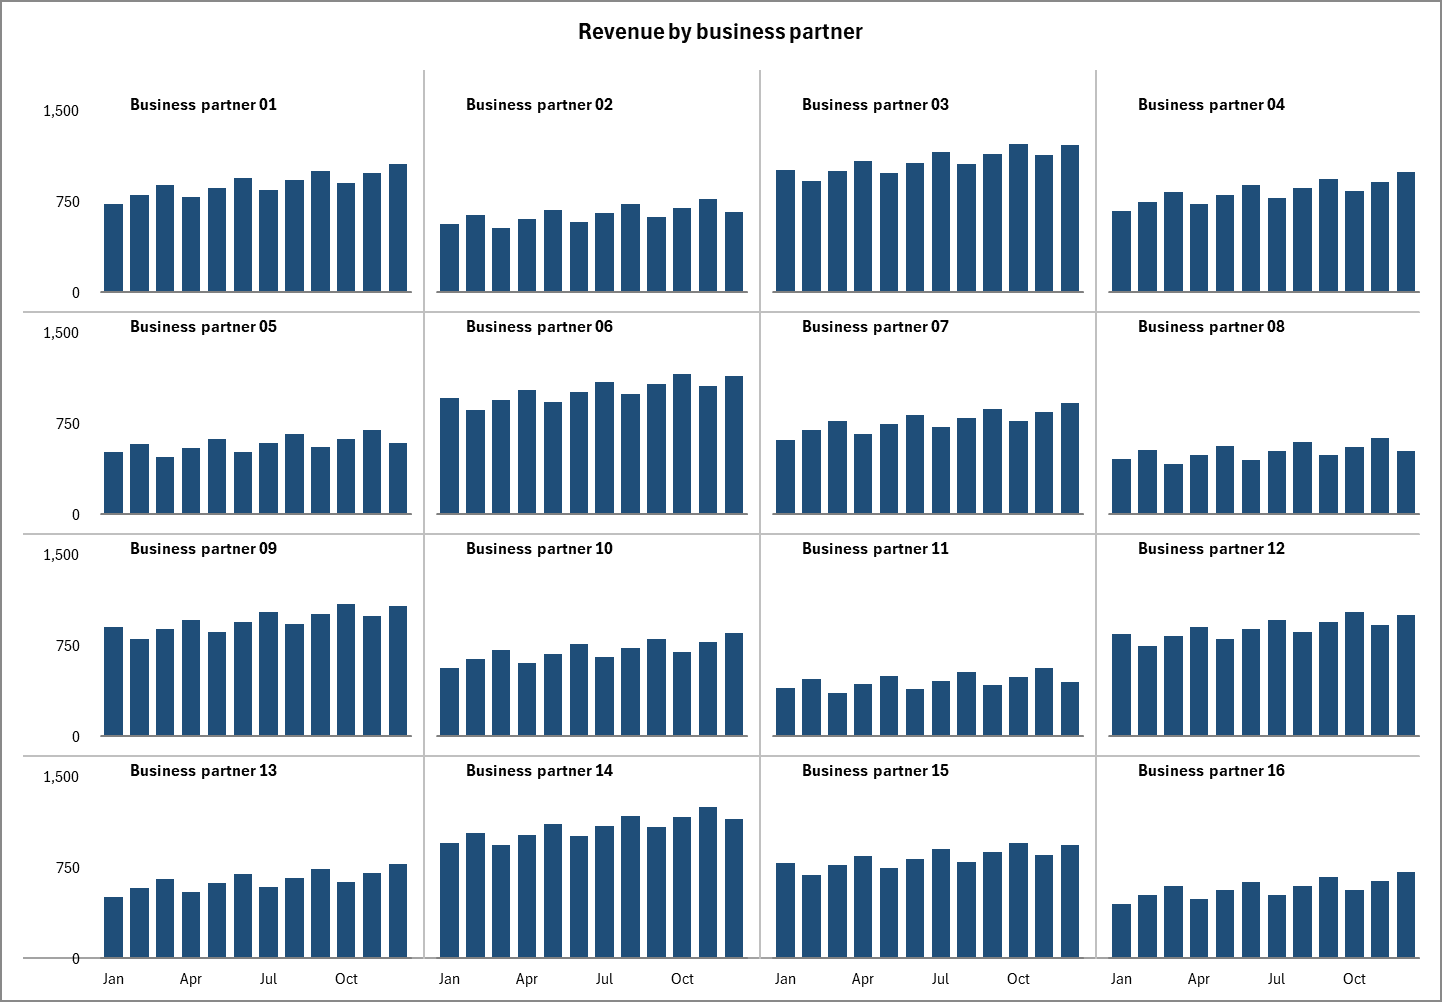 Open the full-size image in a new tab
4 × 4 column 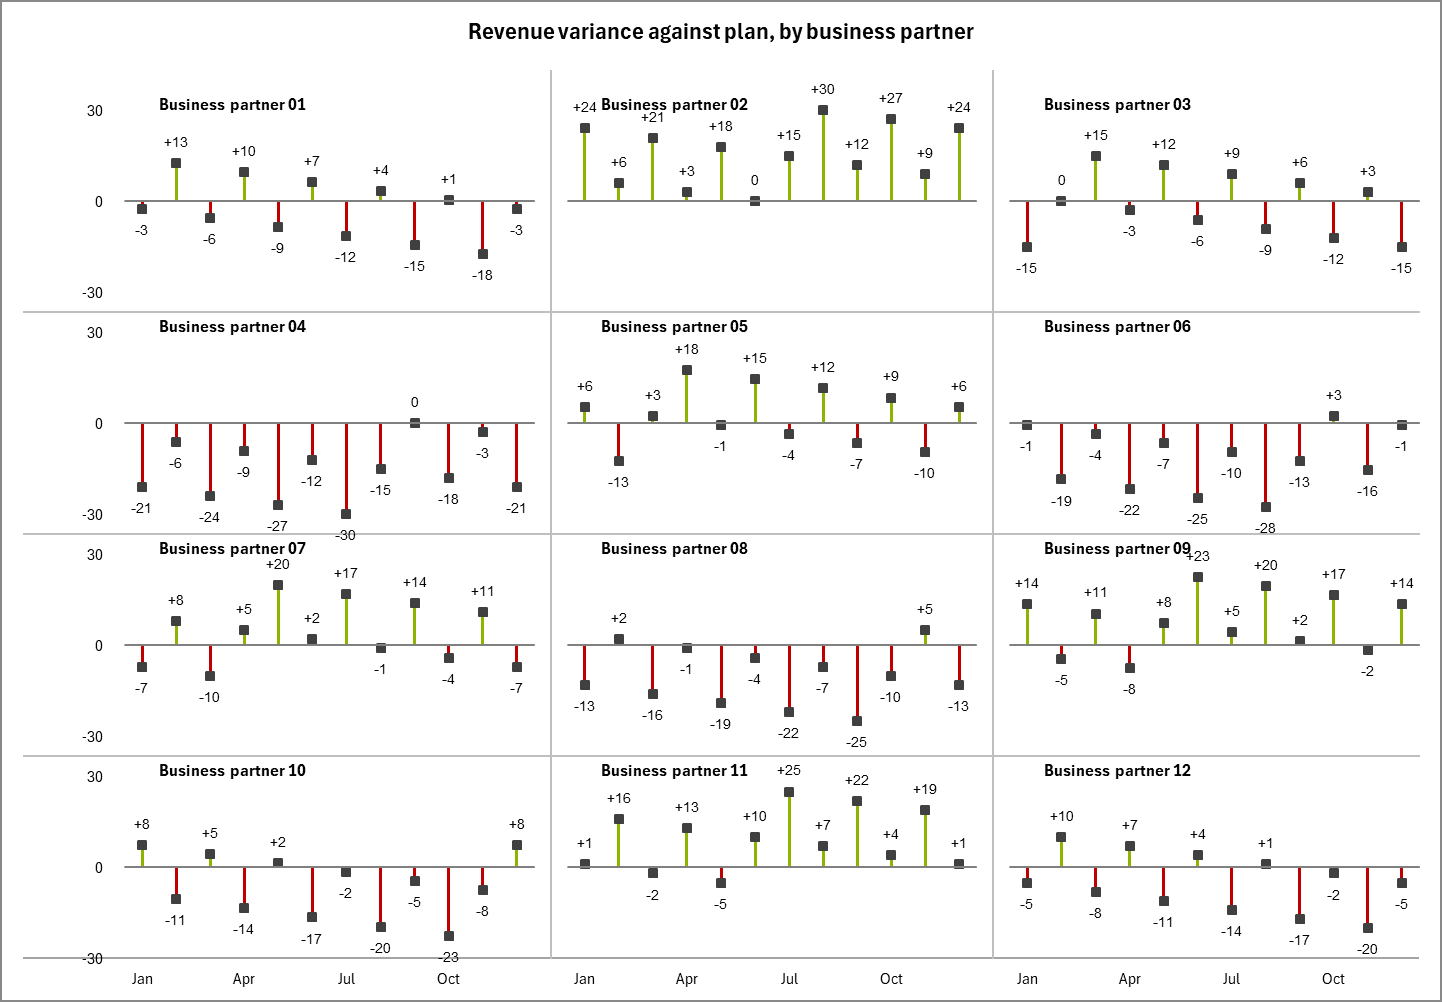 Open the full-size image in a new tab
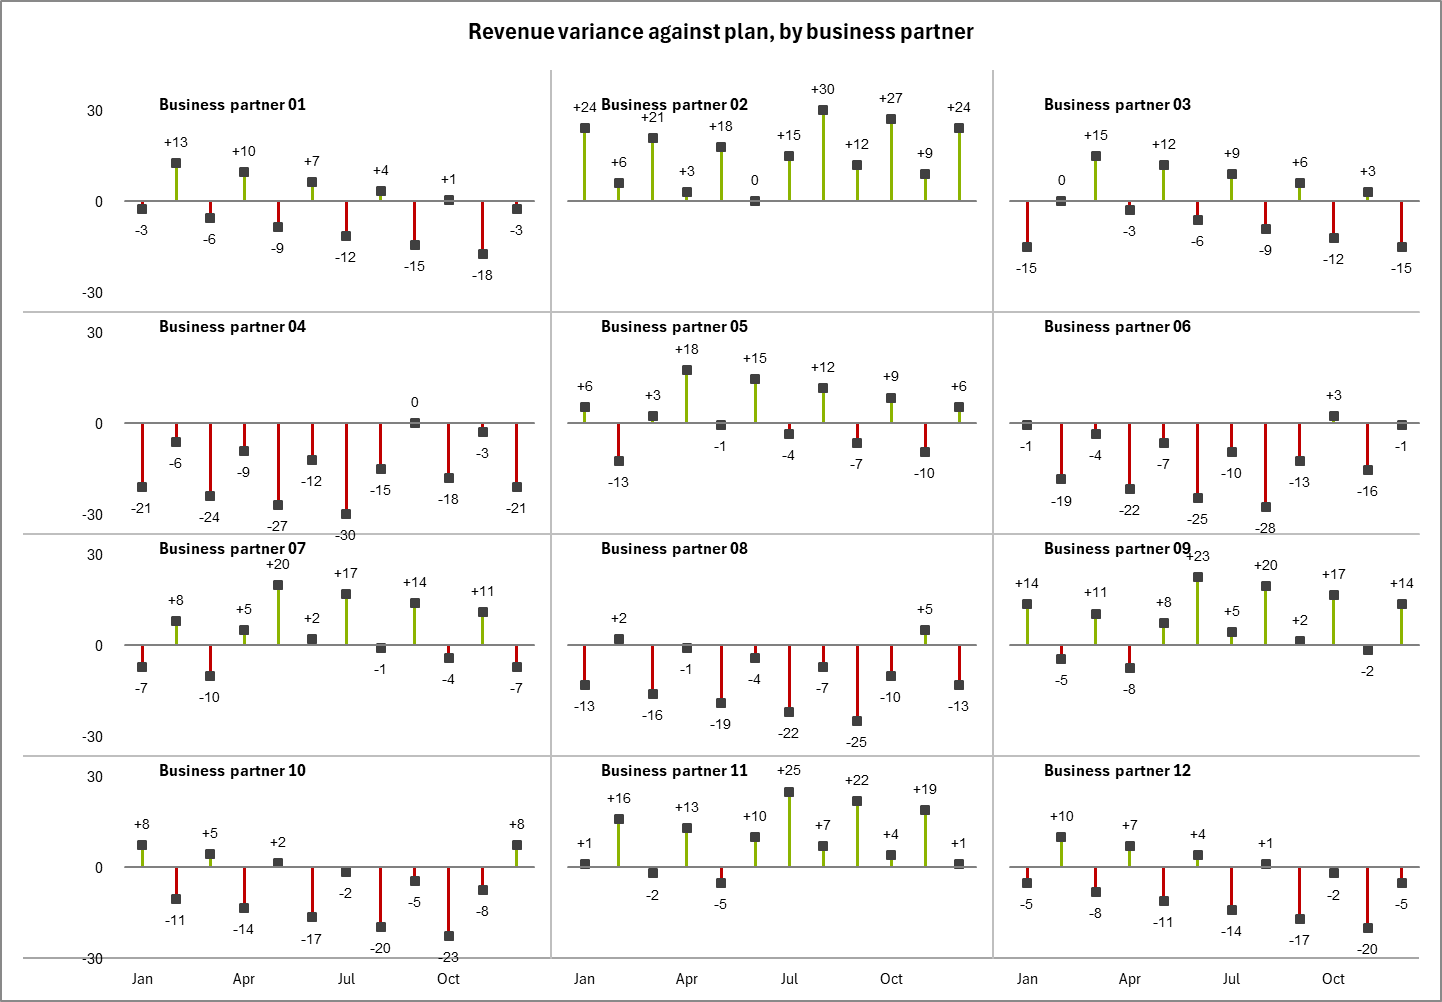
4 × 3 pin 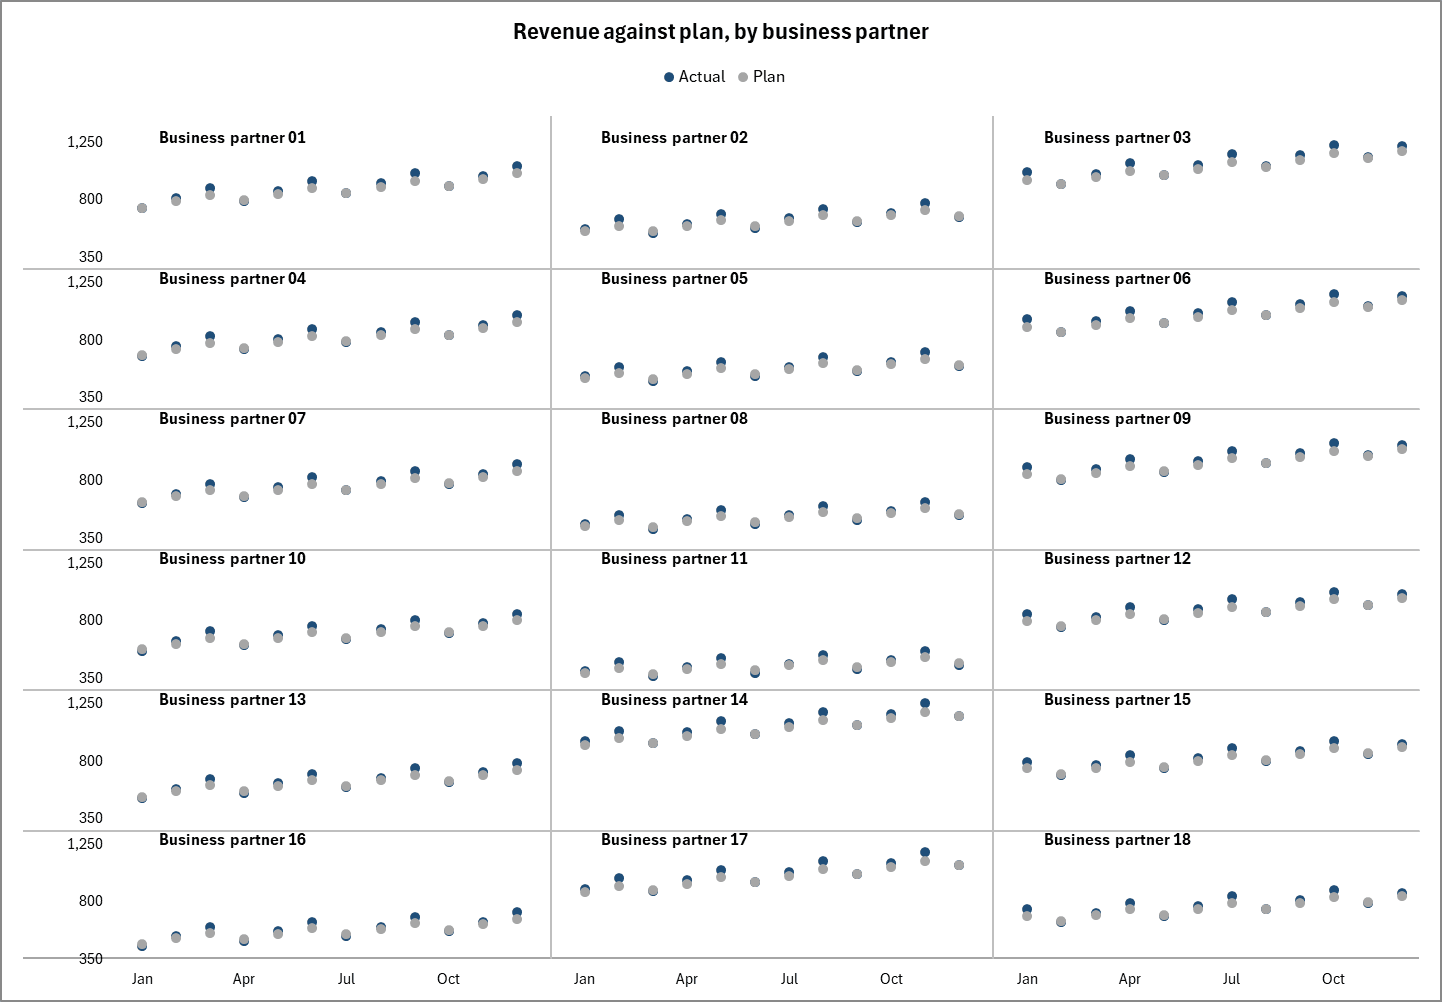 Open the full-size image in a new tab
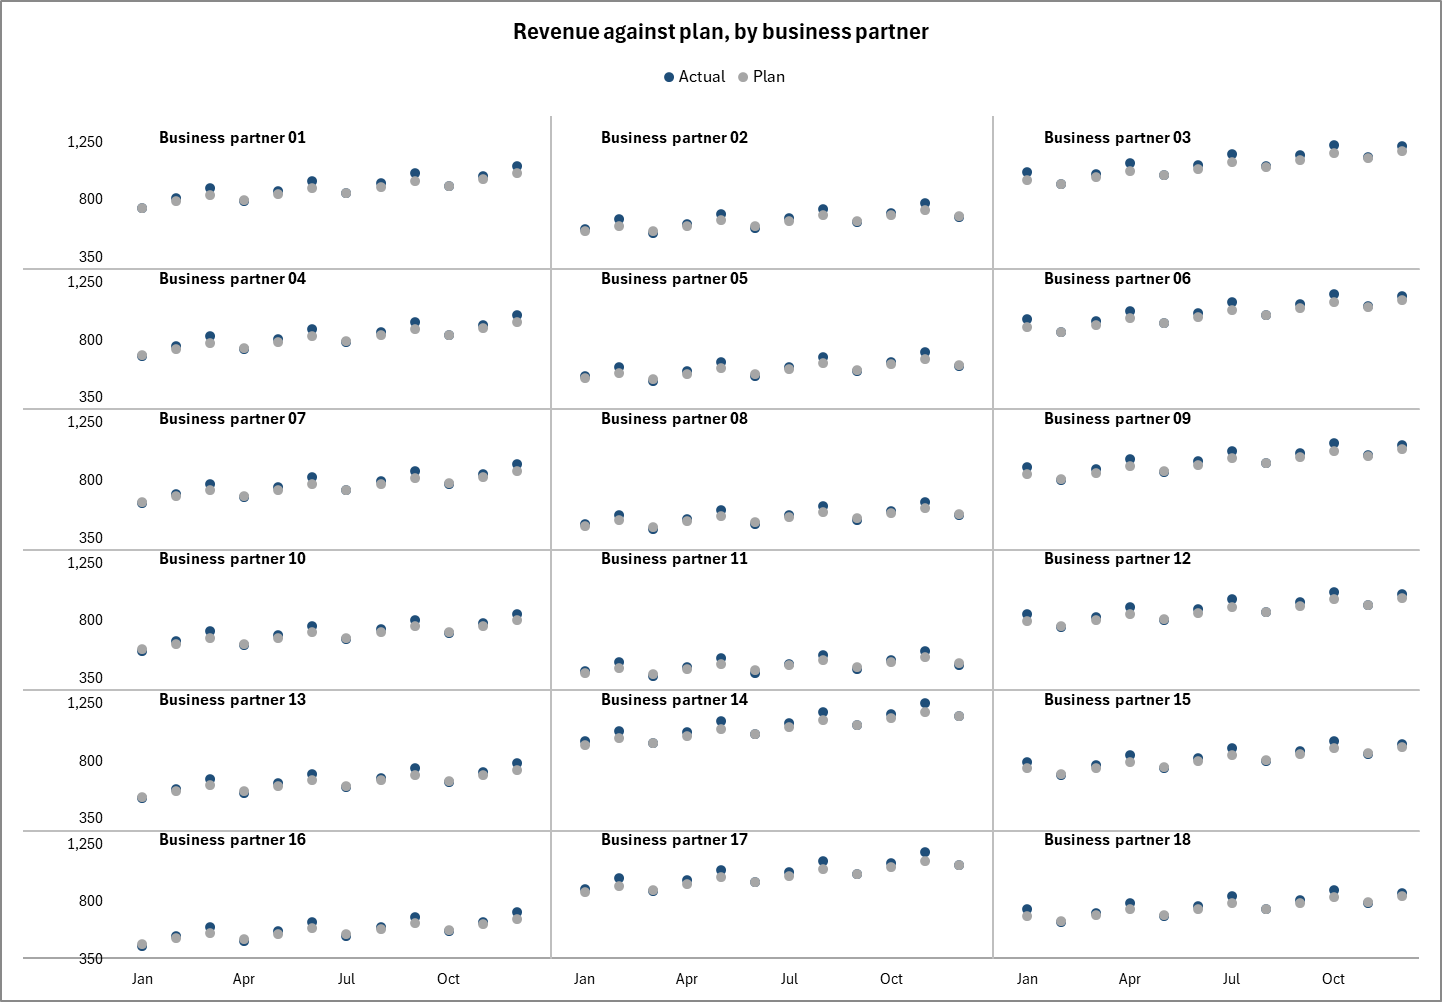
6 × 3 dot
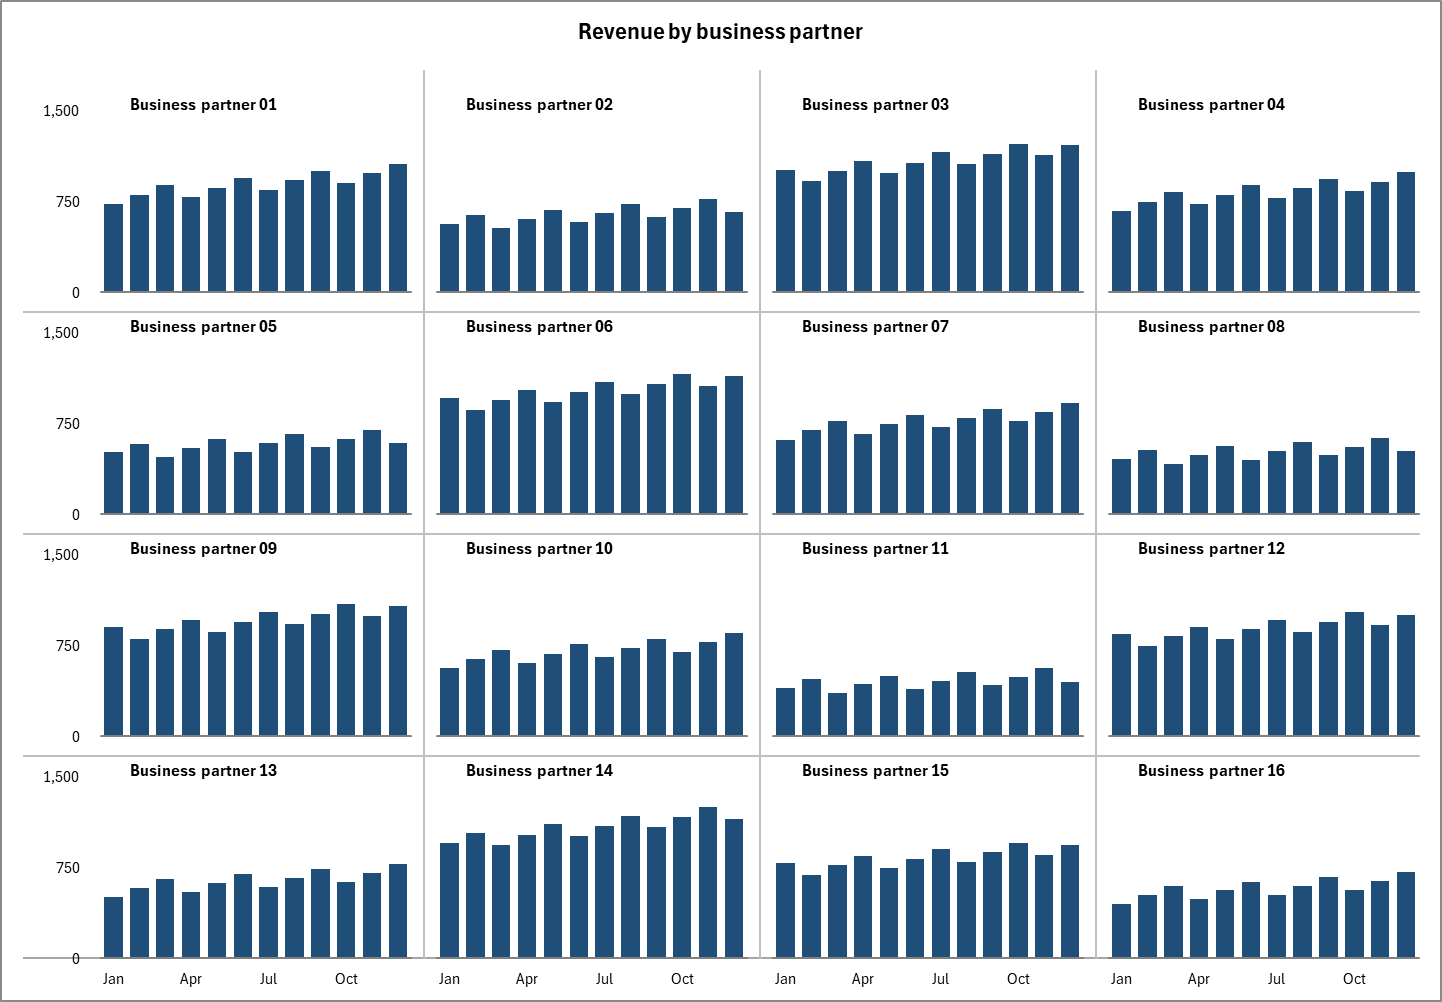
Detail
The obvious way to build one in Excel is to make a chart and copy it fifteen times. That gives you fifteen chart objects with fifteen value axes, and the moment one panel's data moves, its axis rescales and the grid silently stops meaning what it looks like it means. Nothing warns you. The picture still looks like a small multiple.
This solution builds the whole grid as a single native chart object. Difficult but correct. The value axis is divided into bands, one per grid row, and every panel is plotted into its band against one minimum and one maximum for the entire sheet. One axis, one scale, no drift — and because it is a native chart with live formulas behind it, you can still click a cell and watch the grid move.
Six chart types ship as worked examples — line, column, area, bar, pin and dot — each at a different grid size. The pin chart is drawn with a marker plus a custom Y error bar as its stem, because Excel caps gap width at 500% and a column simply will not go thin enough.
You do not need Claude Code to get value from the file. The workbook is a living document that updates when the placeholder data changes — paste your own numbers over the input block and the grid redraws itself. The guide walks the same construction by hand, for anyone who would rather build it themselves, or who needs it in a workbook they cannot run Python against.
The Claude Code skill can, however, create panel charts at grid sizes other than the six demonstrated in the spreadsheet. This skill carries its weight as laying out panel grids manually in Excel is tedious work.
It is free to use and free to modify — MIT licensed, with no attribution required.