Excel add-in · Free to use, free to modify
XL Edge: a LAMBDA library that lives in the ribbon plus more
Store, search, edit and share custom LAMBDA functions from a ribbon group instead of Name Manager — plus panel charts, Monte Carlo simulation from distributions to finished charts, and years of productivity macros.
- Excel add-in
- VBA
- LAMBDA
- Charts
- Monte Carlo

Detail
Custom LAMBDA functions are powerful and almost impossible to manage. They live in Name Manager, one workbook at a time, with a text box for a formula and nowhere to record what the thing actually does. Moving a function between workbooks means copying strings by hand.
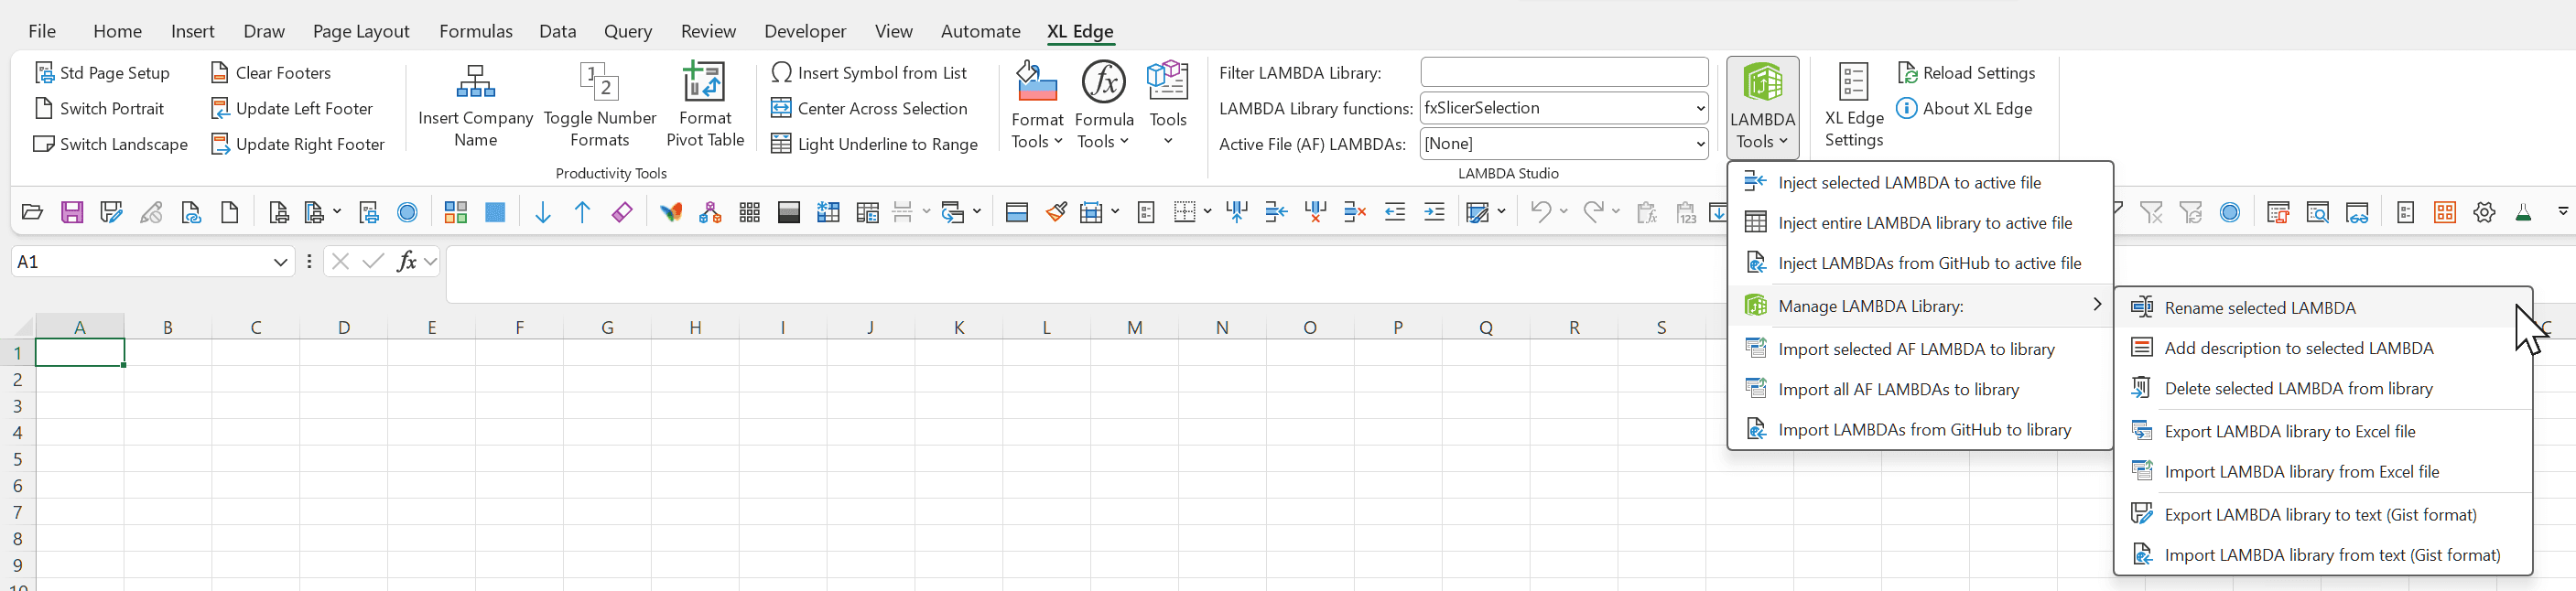
XL Edge adds a LAMBDA Studio group to the Excel ribbon: a stored library of functions with descriptions, a live dropdown, and export or import in two formats — an Excel workbook for colleagues, and the Advanced Formula Environment gist format for anyone publishing to GitHub. The library starts small on purpose, with five functions: the z-score outlier and slicer LAMBDAs from the outlier detection project on this site. The rest of the library is yours to fill.
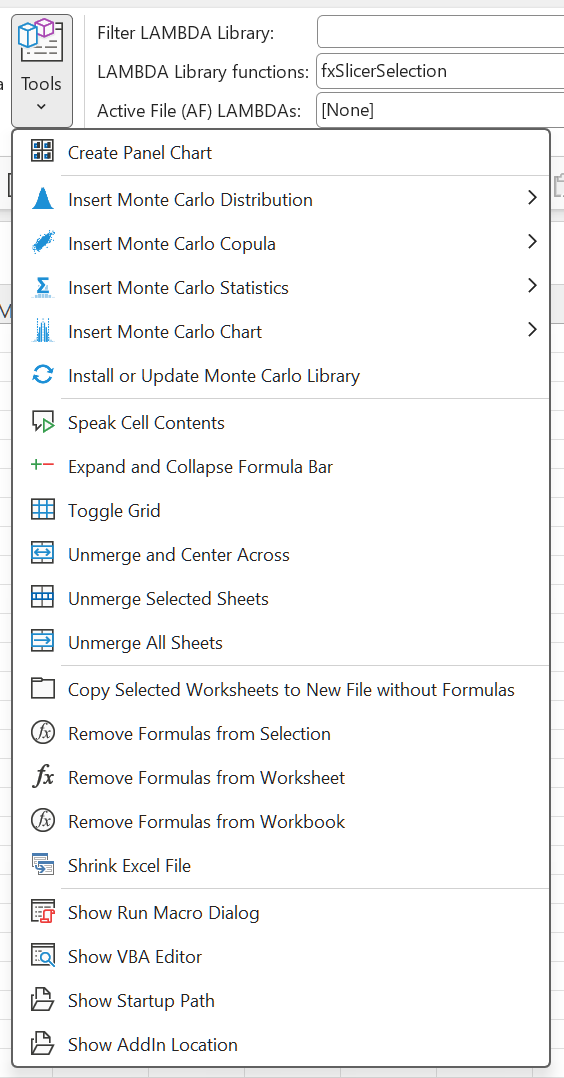
The Tools menu opens with Create Panel Chart: a grid of small charts — one per region, product or partner — sharing a single scale, built as one native chart object rather than a dozen copies whose axes drift apart the moment the data changes. Select a block of data to build from it, or run it with nothing selected to get a placeholder block to paste over.
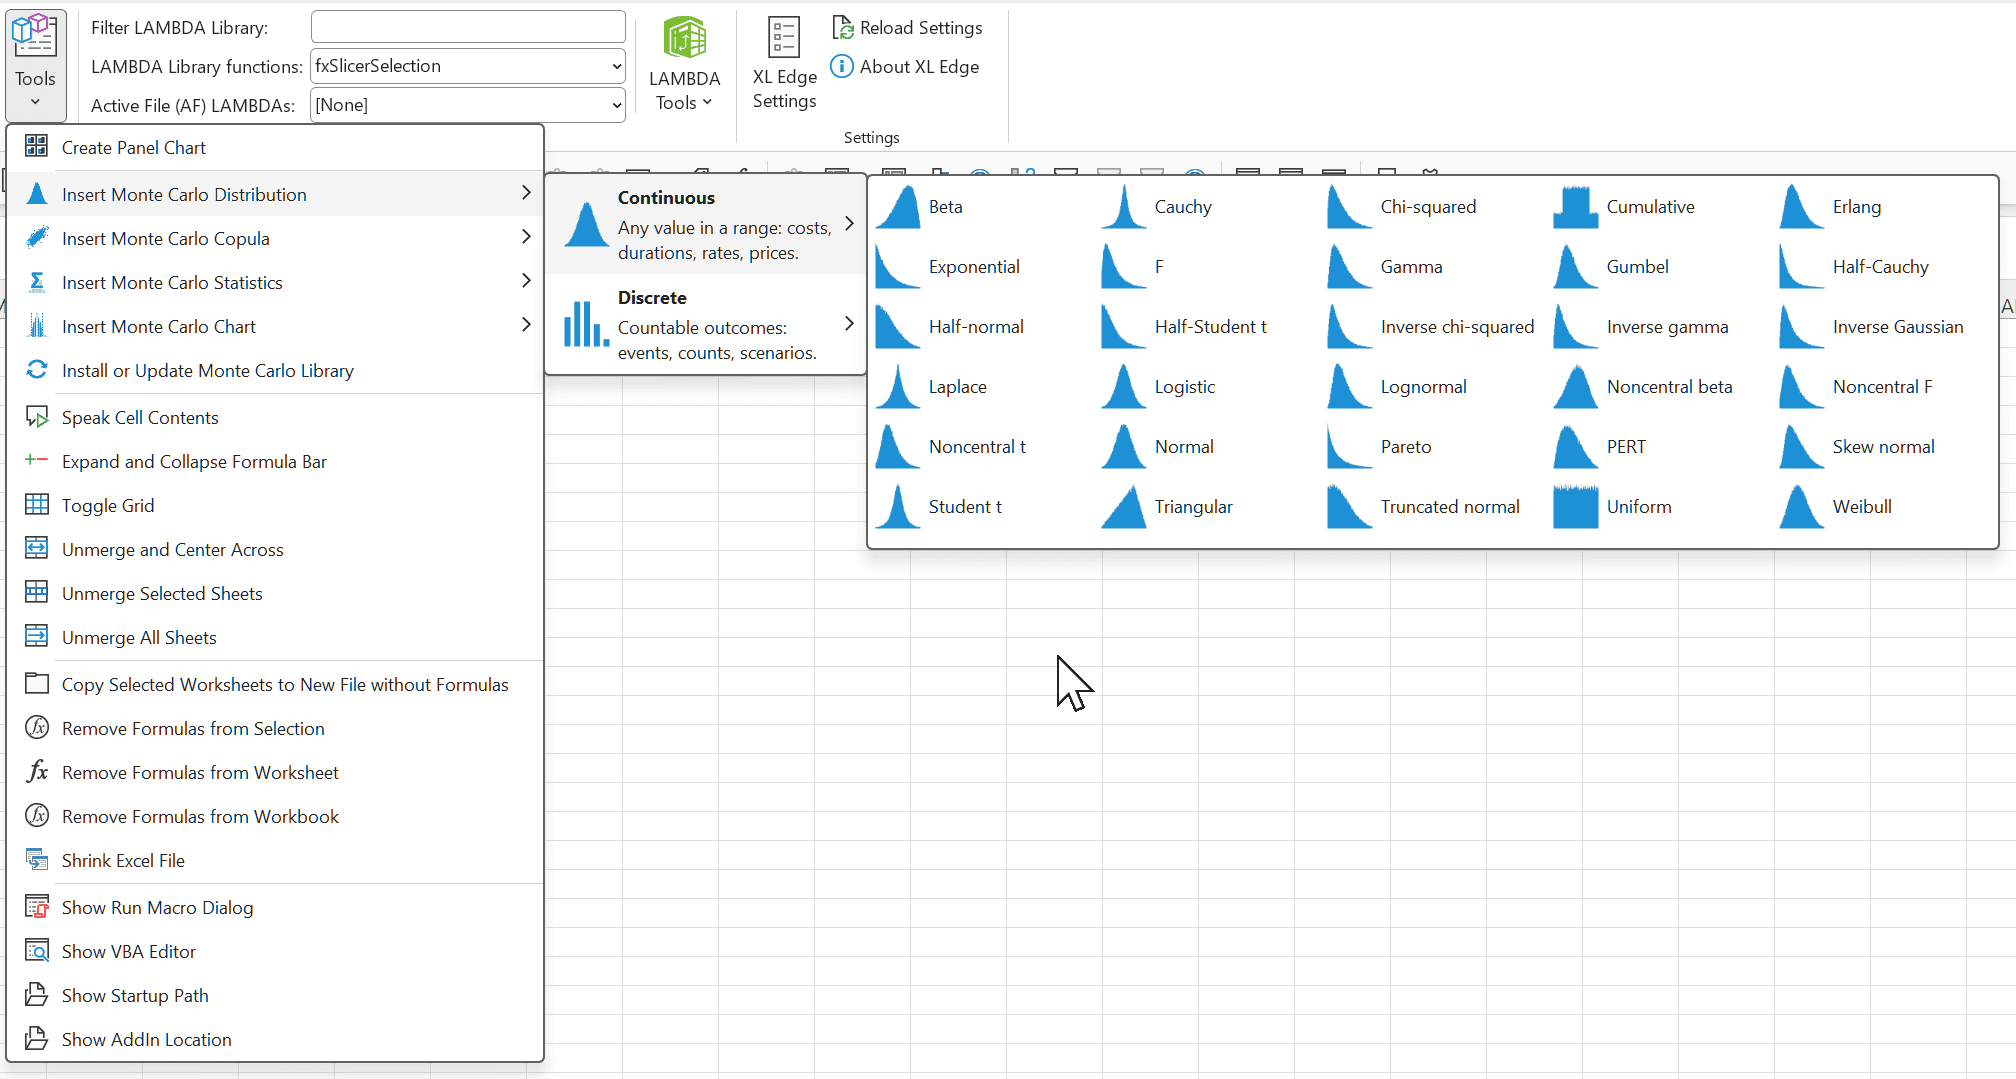
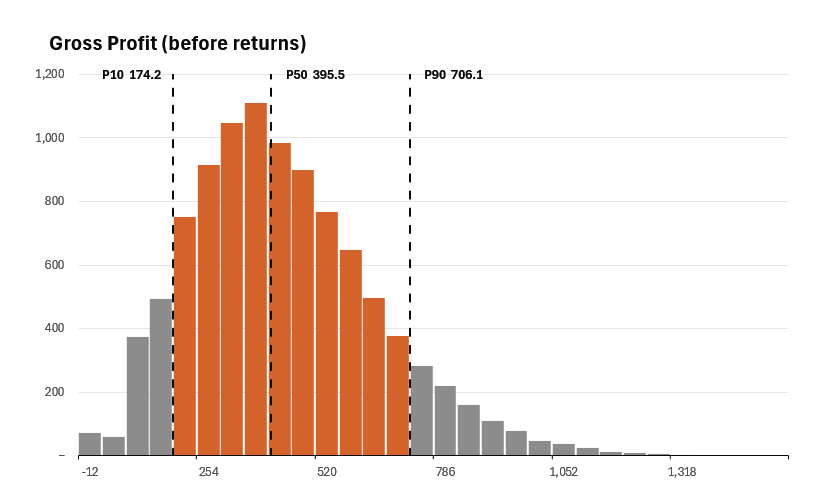
Next on that menu, Monte Carlo simulation. Thirty-nine distributions — thirty continuous, from normal, PERT and triangular to Student t, Pareto and the noncentral family, and nine discrete, including Poisson, geometric and Benford's law — go into the workbook as LAMBDA functions, modern versions of the distribution formulas found in tools such as XLRisk and @RISK. Five copulas make inputs move together, so price and volume or frequency and severity are not sampled as if they were unrelated. The Statistics fly-out writes a summary for one result or a table for several, plus the risk measures: Value at Risk, Conditional Value at Risk and Expected Shortfall. The Chart fly-out finishes the job with a native Excel chart — a histogram with its S-curve, an outcome histogram marked at P10, P50 and P90, or a tornado ranking the inputs. Each distribution is a non-volatile dynamic array formula: a single cell spills every trial, and the trials stay put when something unrelated recalculates, because the randomness is keyed to a seed rather than to RAND. The add-in installs only the functions a workbook uses, from its own copy, and only writes formulas, so a finished model keeps working for colleagues who only have the Excel workbook. There is no simulation loop to run — the model is ordinary array arithmetic.
The add-in includes additional productivity macros developed over years. All were recently refactored by Claude Code using my "excel-macro-optimizer" skill. This ensures modern coding standards are used to assist with speed, reliability, and maintainability.
It is free to use and free to modify — MIT licensed and unrestricted. No sign-up, no trial, no marketing emails.
Reference
What's on each menu
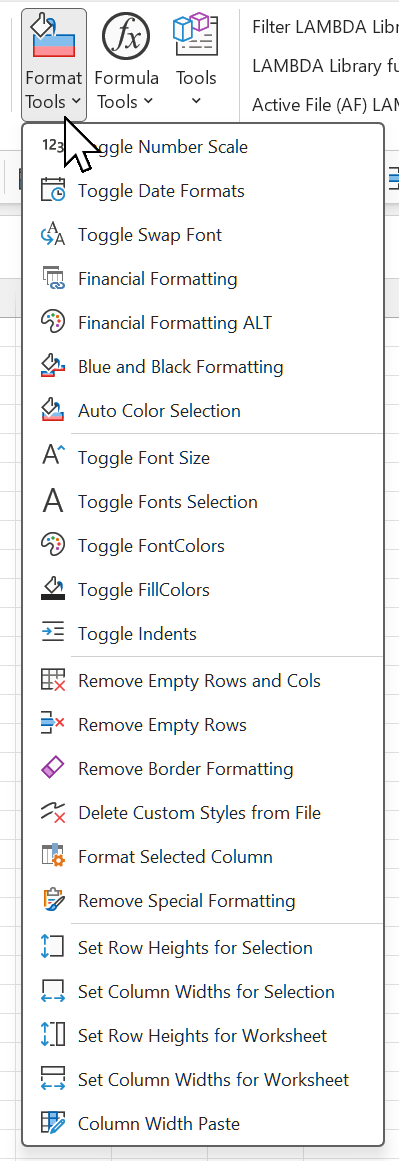
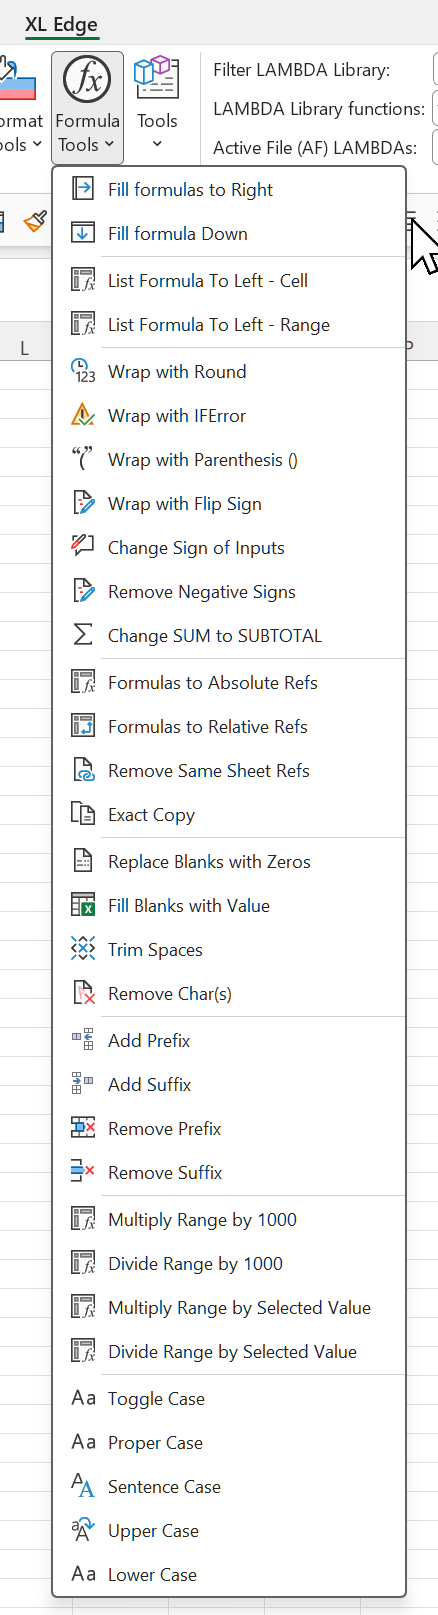
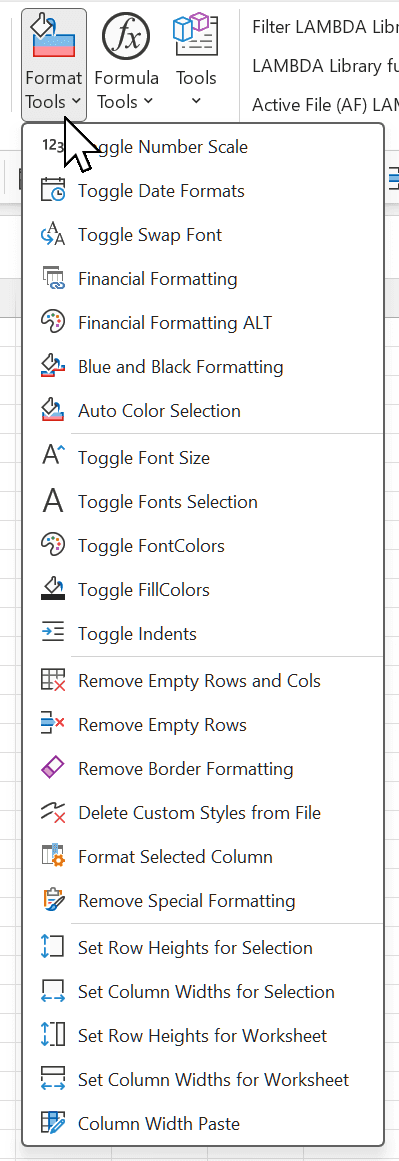
The three Productivity Tools menus. Each one is clipped to fit here — click any of them to open the full-size screenshot and read every item.
 Open the full-size image in a new tab
Format Tools 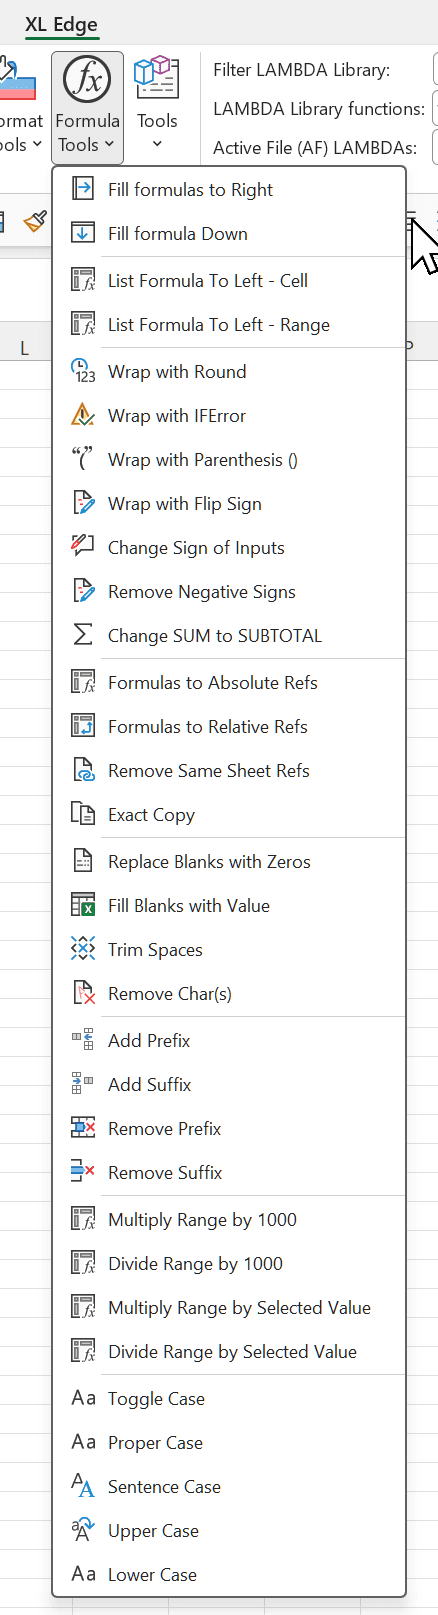 Open the full-size image in a new tab
Formula Tools 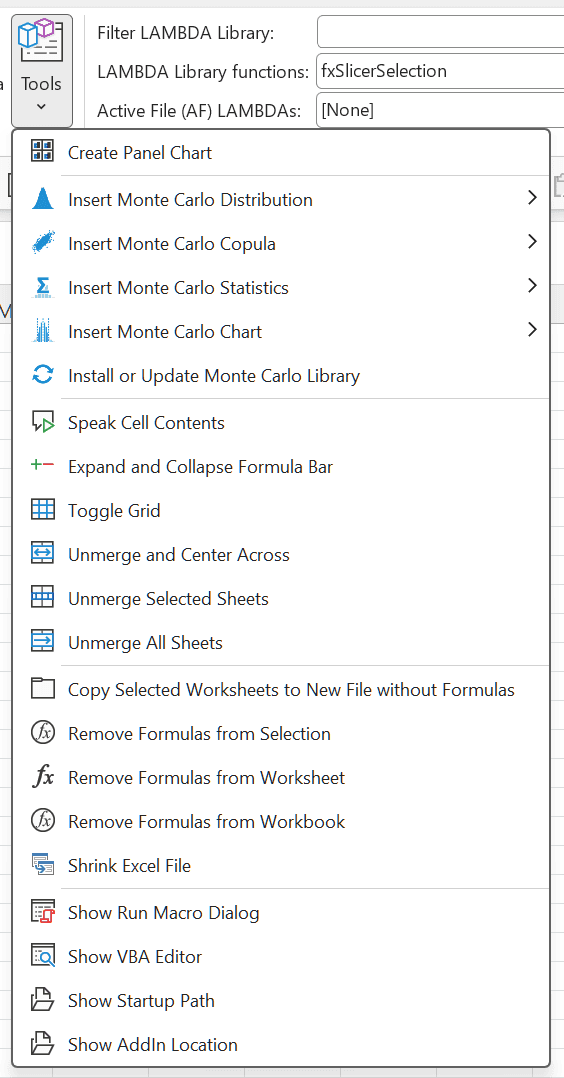 Open the full-size image in a new tab
Tools